In this tutorial, the experimental goal is to identify regions with copy number changes in multiple patients. To do this, we will create a list containing deleted and amplified regions across the genome shared by 8 or more samples.
- Select Create Region List from the Copy Number Analysis section of the Copy Number workflow
- Select Specify New Criteria
We want to include all the amplified regions across the genome shared by at least 8 samples in our first criteria (Figure 1).
- Set Name to Amplified
- Set Spreadsheet to 2/segmentation/summary (segment-analysis)
- Set Column to 6. Total Amplifications using the drop-down menu
- Deselect the box next to Include values less than or equal to
- Set Include values greater than or equal to value to 8
The # pass should be 86, indicating that 86 regions meet the criteria.
- Select OK
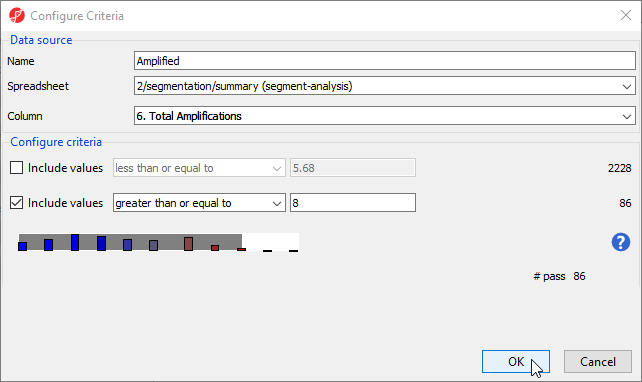
Figure 1. Configuring the Amplified criteria
- Select Save to save the list
- Select OK to confirm that you would like to save Amplified as a list
- Select Close to exit the List Creator dialog
Amplified is now open in the Analysis tab as a child spreadsheet of segmentation. Although this list contains regions amplified in 8 or more samples, some samples may also contain deletions in the same regions. For downstream analysis, we may want to filter out these regions to create a final list with only amplified regions. Here, we will use the interactive filter.
- Select the Amplified spreadsheet
- Select
 to open the interactive filter
 - Set the Column drop-down list to 8. Total Deletions
- Type 0 in the Max box
- Select Enter on your keyboard
This will apply a filter excluding any region with deletions (Figure 2).
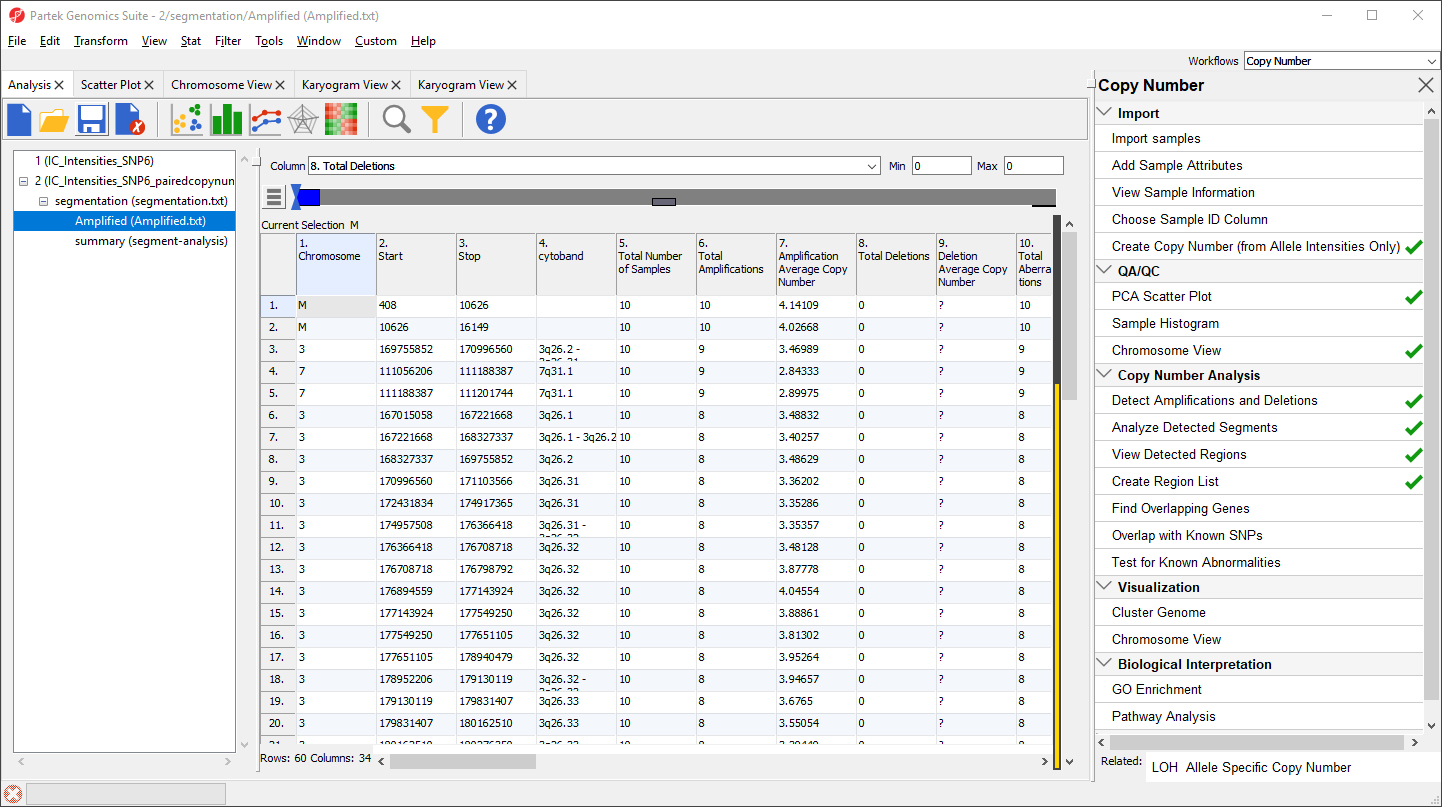
Figure 2. Interactive filter excluding regions with deletions.
The yellow and black bar on the right-hand side of the spreadsheet indicates the porportion of rows that have been filtered. Next, we can save the filtered list.
- Right-click the Amplified spreadsheet in the spreadsheet trees
- Select Clone... from the pop-up menu
- Set the Name of the new spreadsheet to amplified_only
- Set Create new spreadsheet as a child of spreadsheet to 2/segmentation (segmentation.txt)
- Select OK
The new spreadsheet is a temporary file. To keep the spreadsheet, we need to save it.
- Select amplified_only in the spreadsheet tree
- Select

- Set the file name as amplified_only
- Select Save
The amplified_only spreadsheet contains 60 rows and includes regions that were amplified in 8 or more samples and not deleted in any sample.
To create a list of regions only deleted in 8 or more samples, repeat the above steps for deleted regions. You should create a final list, deleted_only, with 92 regions.
Next, we can merge the two lists to create a spreadsheet with both deleted and amplified regions.
- Select File from the main taskbar
- Select Merge Spreadsheets...
- Select the Append Rows tab
- Select 2/segmentation/deleted_only (deleted_only) from the First Spreadsheet drop-down menu
- Select 2/segmentation/amplified_only (amplified_only) from the Second Spreadsheet drop-down menu
- Name the merged spreadsheet amplified_or_deleted using the Specify Output File (Figure 3)
- Select OK
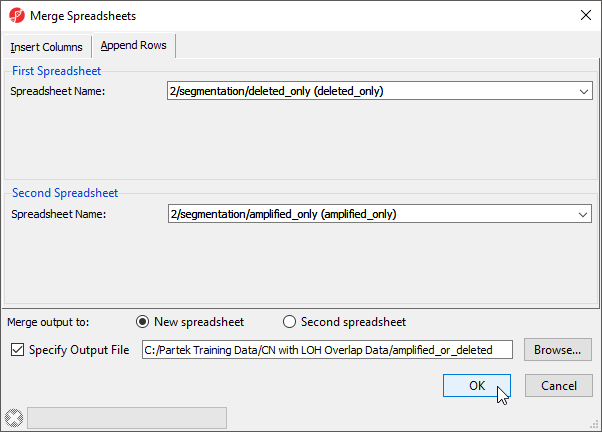 Figure 3. Merging amplified and deleted spreadsheets
- Select the new spreadsheet, amplified_or_deleted in the spreadsheet tree
- Select to save the spreadsheet
This spreadsheet, amplified_or_deleted, will be used as the basis for the downstream steps in this analysis.
Additional Assistance
If you need additional assistance, please visit our support page to submit a help ticket or find phone numbers for regional support.


| Your Rating: |
|
Results: |

|
34 | rates |
Overview
Content Tools