In case when a Flow task fails altogether (no project report is produced), please follow the directions in Reporting a problem.
If the task report is produced, but the results are missing for some features (Figure 1), it may be because something went wrong inside the estimation procedure. It may be possible to understand what happened using the information available in the project report. That type of information is present for many Flow tasks, including Differential Analysis and Survival Analysis.
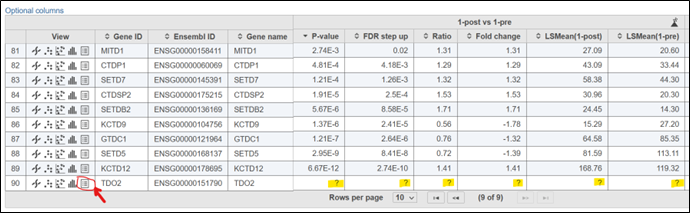
Figure 1. Use “View extra details report” button to see why the results are missing.
Clicking “View extra details report” button for the feature of interest (Figure 1) will display the “Extra details” report (Figure 2). When the estimation procedure fails, one is going to see a red triangle next to the information criteria value. Hover over the triangle to see a detailed error message.
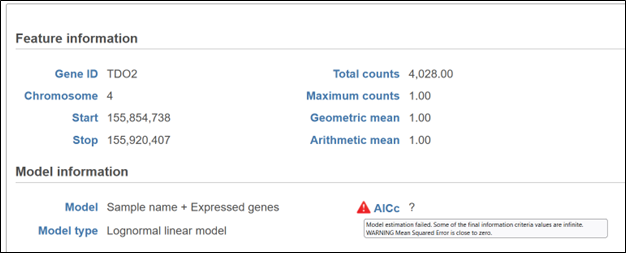
Figure 2. . The error message shows up if one hovers over the colored triangle.
In many cases, estimation failure is due to low expression. For instance, in Figure 2 an ANOVA model is used and, since the mean and maximum expression for gene TDO2 are all equal to 1, one can guess that all of TDO2 expression values are equal to 1. That is a corner case that ANOVA cannot handle.
Sometimes the estimation results are not missing but the reported values look inadequate. In that case, using Extra details report may show that the estimation procedure generated a warning, in which case the triangle turns yellow. In order to get rid of such suspicious results in the report, set “Use only reliable results” to Yes in Advanced Options (Figure 3). In that case, the warnings are going to be treated the same way as estimation failures.
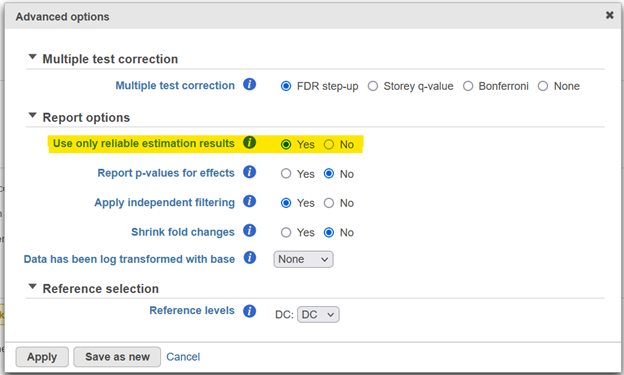
Figure 3. If only reliable results are used, features with warnings are not reported.
On the other hand, you may wish to see the results for as many features as possible, regardless of how reliable they are. For instance, DESeq2 uses the so-called Cook’s distances to flag features with outlying expression values. If “Use reliable results” is set to Yes (Figure 3) the p-values for such features are not reported which may lead to some missing values in the report. To avoid that, set “Use only reliable results” to No and the result will be reported unless there is an estimation failure.
Additional Assistance
If you need additional assistance, please visit our support page to submit a help ticket or find phone numbers for regional support.


| Your Rating: |
|
Results: |

|
0 | rates |
Overview
Content Tools