Gene Set Enrichment Analysis is a bioinformatics tool that determines whether a set of genes (e.g. a gene ontology (GO) group or a pathway) shows statistically significant, concordant differences between two experimental groups (1,2). Briefly, the goal of GSEA is to determine whether the genes belonging to a gene set are randomly distributed throughout the ranked (by expression) list of all the genes that should be taken into consideration (e.g. gene model), or are primarily found at the top or at the bottom of the list.
Prerequisites
To run GSEA, your project has to contain at least one categorical factor with exactly two levels (e.g. Treated and Control). If you are running GSEA on RNA-seq data, note that some common normalisation transformations, such as fragments/reads per kilobase of transcript per million mapped reads (FPKM/RPKM) or transcripts per million (TPM) are not considered suitable for GSEA (for more information, please see GSEA documentation). Instead, you should use an approach such as DESeq2 normalisation, trimmed means of M (TMM), or geometric mean.
Running GSEA
To launch GSEA, select the data node with normalised data and then go to Biological interpretation > GSEA (Figure 1).
 Figure 1. Gene Set Enrichment Analysis task in the toolbox
Use the first dialog (Figure 2) to specify the gene sets. You can run GSEA on pathways (currently based on Kyoto Encyclopedia of Genes and Genomse (KEGG) pathways) or on other gene set databases. When using the KEGG option, the KEGG database is automatically set, based on the upstream nodes. The Gene set size options allows you to restrict your analysis on gene sets of certain size (i.e. number of genes).
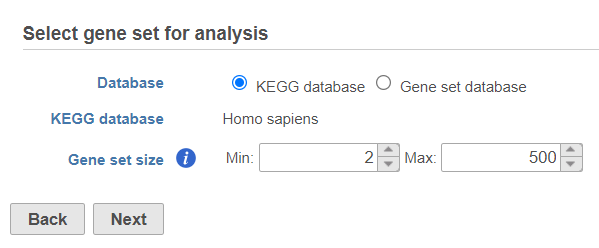 Figure 2. Select gene set for analysis dialog is used to specify gene sets
If you select Gene set database, two additional options will appear. Genome build will be detected automatically, based on the upstream nodes. The gene sets that are available for that build are listed in the drop down list (Figure 3). Custom databases will be labeled by their name as specified in the Library file management, while GO database will be labeled by the release date (as seen in Figure 3).
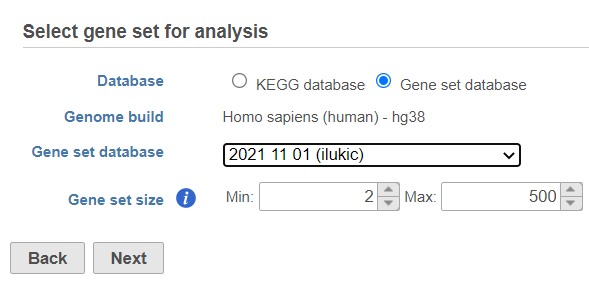 Figure 3. Specifying gene set database for GSEA analysis
Once your choices are made, push Next to proceed.
In the second part of the set up (Figure 4) pick the experimental factor for GSEA (in this example: Condition, Stim, Numeric). The dialog will list only the factors with two categories; if your project contains additional factors, which have a single category or more than two categories, a warning message will be displayed at the top.
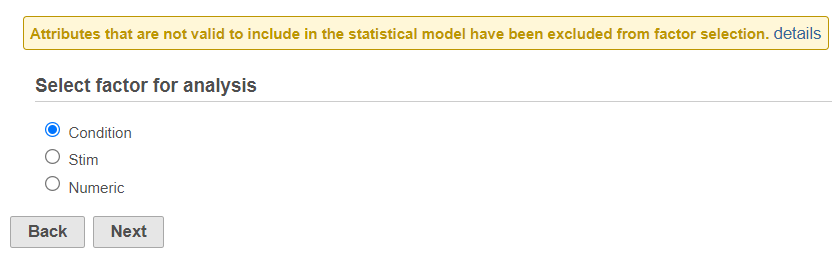 Figure 4. Select factor for analysis dialog. Only factors with two categories are enabled. The warning message indicates that some of the factors in the current project have either a single category, or more than two categories
If the warning message is displayed, click on the details link to see which factors are unavailable and why (Figure 5).
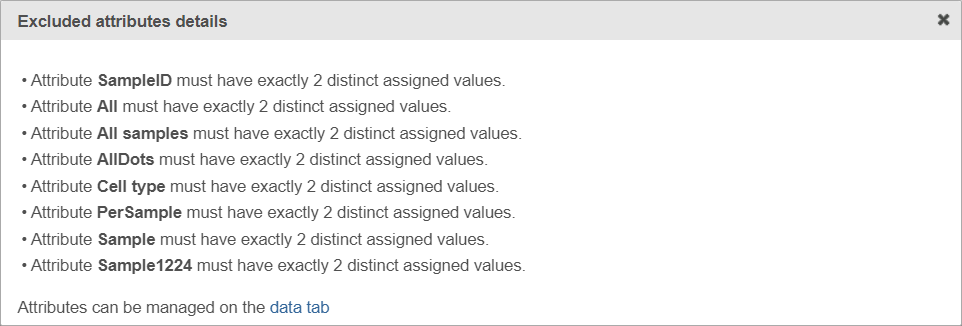 Figure 5. Excluded attributes details page listing experimental factors which are not available for the GSEA analysis
Select the experimental factor that you want to run GSEA on and push Next.
The third dialog is Define comparisons (Figure 6). The box on the left side displays the categories of the selected factor (shown as Factor). Use the arrow buttons (>) to move one of the factors to the Denominator box (that factor should be interpreted as the reference category) and the other factor to the Numerator box. Confirm your selection by pushing the Add comparison button and the comparison will be added to the Comparisons table.
 Figure 6. Use the dialog to specify the reference category (Denominator) and the test category (Numerator). In the example, the Dependent group is the test category and is compared relative to the Control group
Push Finish to launch GSEA with the default settings or click on the Configure icon to customize the analysis (Figure 7).
References
- Subramanian A, Tamayo P, Mootha VK, et al. Gene set enrichment analysis: a knowledge-based approach for interpreting genome-wide expression profiles. Proc Natl Acad Sci U S A. 2005;102(43):15545-15550. doi:10.1073/pnas.0506580102
- Mootha VK, Lindgren CM, Eriksson KF, et al. PGC-1alpha-responsive genes involved in oxidative phosphorylation are coordinately downregulated in human diabetes. Nat Genet. 2003;34(3):267-273. doi:10.1038/ng1180
Overview
Content Tools