After samples have been added and associated with valid data files, in a Partek® Flow® project, a data node will appear in the Analyses tab (Figure 1). The Analyses tab is where different analysis tools and the corresponding reports are accessed.
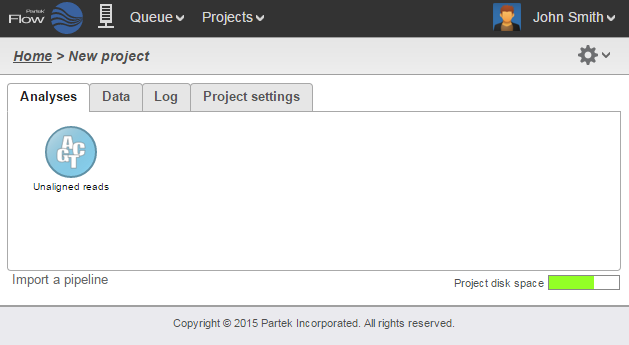
Figure 1. The Analyses tab showing a data node of unaligned reads
Data and Task nodes
The Analyses tab contains two elements: data nodes (circles) and task nodes (rounded rectangles) connected by lines and arrows. Collectively, they represent a data analysis pipeline.
Data nodes (Figure 2) may represent a file imported into the project, or a file generated by Partek Flow as an output of a task (e.g., alignment of FASTQ files generates BAM files).


Figure 2. Examples of different types of data nodes
Task nodes (Figure 3) represent the analysis steps performed on the data within a project. For details on the tasks available in Partek Flow, see the specific chapters of this user manual dedicated to the different tasks.
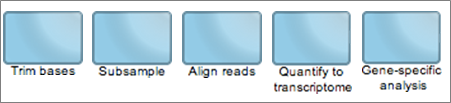
Figure 3. Examples of different types of task nodes
The context sensitive menu
Clicking on a node reveals the context sensitive menu, on the right side of the screen.
Figure 4. The context sensitive menu is revealed when a node is selected
Only the tasks that are available for the selected data node will be listed in the menu. For data nodes, actions that can be performed on that specific data type will appear.
In Figure 4, a node that contains Unaligned reads is selected (bold black line). The tasks listed are the ones that can be performed on unaligned data (QA/QC, Pre-analysis tools, and Aligners).
To hide the task pane, simply click the symbol on the upper left corner of the task pane. Clicking the triangles will collapse (
) or expand (
) the different categories of tasks that are shown.
After a task is performed on a data node, a new task node is created and connected to the original data node. Depending on the task, a new data node may automatically be generated that contains the resulting data.
In Figure 5, alignment was performed on the unaligned reads. Two additional nodes were added: a task node for Align reads and an output data node containing the Aligned reads.
Figure 5. Certain tasks performed on a data node generate additional data nodes. The example shows the Aligned reads node, which was generated upon alignment of the Unaligned reads node
Running a task
To run a task, select a data node and then locate the task you wish to perform from the task pane. Mouse over to see a description of the action to be performed. Click the specific task, set the additional parameters (Figure 6), and click Finish. The task will be scheduled, the display will refresh, and the screen will return to the project's Analyses tab.
In Figure 6, the STAR aligner was selected and the choices for the aligner index and additional alignment options appeared.
Figure 6. Running a STAR alignment task in Partek Flow. Dialog boxes to set the parameters appear
Tasks that are currently running (or scheduled in the queue) appear as translucent nodes. The progress of the task is indicated by the progress bar within the task node. Hovering the mouse pointer over the node will highlight the related nodes (with a thin black outline) and display the status of the task (Figure 7).
If a task is expected to generate data nodes, expected nodes appear even before the task is completed. They will have a lighter shade of color to indicate that they have not yet been generated as the task is still being performed. Once all tasks are done, all nodes would appear in the same shade.
Figure 7. A running task showing the progress indicator. The output data node, also in the lighter shade of color, appears even before the task completes. This enables the user to launch additional tasks while an upstream task is still in progress
Canceling and deleting tasks
Tasks can only be cancelled or deleted by the user that started the task. Running or pending tasks can be canceled by clicking the right mouse button on the task node and then selecting Cancel (Figure 8). Alternatively, the task node may be selected and the Cancel task selected from the task pane.
Figure 8. Canceling a task may be done by right clicking on the running task or by selecting Cancel task in the task panel
Cancelled or failed tasks are flagged by small red circles with exclamation points on the tasks nodes. Data nodes connected to incomplete tasks are also incomplete as no output can be generated (Figure 9). For failure due to errors, see the Task details.
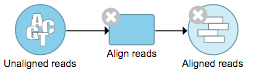
Figure 9. Warnings indicate that the task failed (or was cancelled) and the data node is empty
To delete tasks from the project click the right mouse button on the task node and then select Delete (Figure 10). Alternatively, click the task node and select Delete task from the task pane. The nodes downstream of this task will be deleted. However, deleting the output files is optional (Figure 9, inset).
Figure 10. A task can be deleted by right clicking on the task and selecting Delete or selecting Delete task in the context sensitive menu
Task Results and Task Actions
Selecting a task node will reveal a menu pane with two sections: Task results and Task actions (Figure 11).
Figure 11. Context sensitive menu after selecting a task node
Items from the Task results section inform on the action performed in that node. Certain tasks generate a Task report (Figure 12), which include any tables or charts that the task may have produced.
Figure 12. An example of a Task report for the Trim bases task
The Task details shows detailed diagnostic information about the task (Figure 13). It includes the duration and parameters of the task, lists of input and output files, and the actual commands (in the command line) that were run.
Figure 13. An example of a Task details page for a Pre-alignment QA/QC task
Additionally, the Task details page would contain the error logs of unsuccessful runs. The user can download the logs or send them directly to Partek. This page plays an important role in diagnosing and troubleshooting issues related to task.
Double clicking on a task node will show the Task report page. However, if no report was generated, the user will be directed to the Task details page.
In the Task actions sections, the selected task can be Re-run w/new parameters, and in case it is part of a pipeline that includes additional tasks after it, running the Downstream tasks is an option. Re-running tasks will result in a new layer being made in the Analyses tab.
Another action available for a task node is Add task description (Figure 14), which is a way to add notes to the project. The user can enter a description, which will be displayed when the mouse pointer is hovered over the task node.
Figure 14. Adding a task description
Additional Assistance
If you need additional assistance, please visit our support page to submit a help ticket or find phone numbers for regional support.


| Your Rating: |
|
Results: |

|
0 | rates |
Overview
Content Tools