Setting up Trajectory Analysis
To run Trajectory analysis tool, select the Normalized counts data node (or equivalent) and go to the toolbox: Exploratory analysis > Trajectory analysis
There configuration dialog presents two options.
- Dimensionality of reduced space. This option specifies the number of UMAP dimensions that the original data are reduced to, in order to learn the trajectory tree (dimensionality of original data equals the number of genes). Default is two, meaning that the trajectory plot will be draw in two dimensions. To get a 3D trajectory plot, increase this option to 3.
- Scaling. Normalized expression values can be further transformed by scaling to unit variance and zero mean (i.e. converting to Z score). The use of this option is recommended.
Trajectory Analysis Result
Result of running Trajectory analysis in Partek Flow is the Trajectory result data node. Double clicking on the node opens a Data Viewer window with the trajectory plot (Figure xxx). Cell trajectory graph shows position of each cell (blue dot) with respect to the UMAP coordinates (axes). Cell trajectories (one or more, depending on the data set) are depicted as black lines. Gray circles are trajectory nodes (i.e. cell communities).
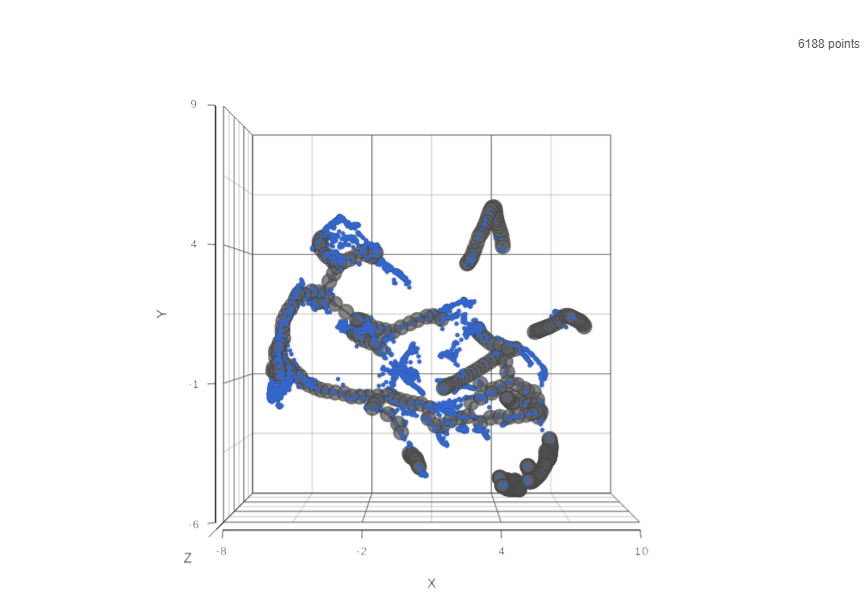 Figure 1. Cell trajectory graph. Blue dots are individual cells (total count is displayed in the upper right). Black line represents the structure of the trajectory graph. Gray circles are nodes or leaves. The axes represent UMAP coordinates.
To show / hide cell trajectory tree and trajectory nodes, use the Extra data option on the Content card (Figure xxx).
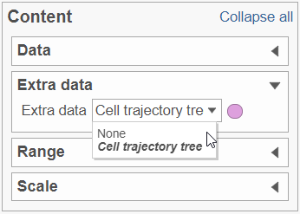 Figure 2. Extra data card enables the user to turn the trajectory tree and the trajectory nodes on or off
Pseudotime Analysis
To perform pseudotime analysis, you need to point to the cells at the beginning of the biological process you are interested in. For example, cells at the earliest stage of differentiation sequence. To start select the root cell nodes (gray circles) by left-click. If the trajectory result consists of more than one trajectory tree, you can specify more than one root node, e.g. one root node per trajectory tree (ctrl & click). If no root node is specified for a tree, that tree will not be included in the pseudotime calculation. Figure xxx shows an example where seven root nodes were identified.
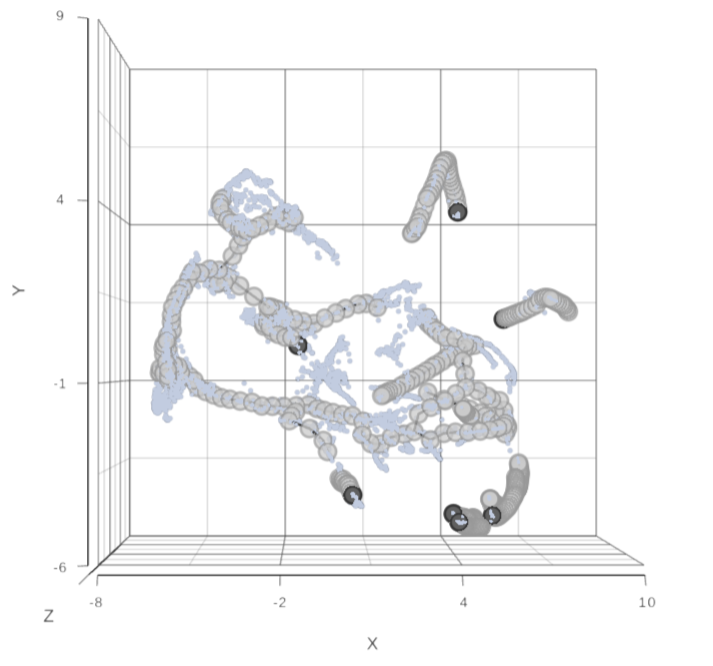 Figure 3. Identification of root nodes for pseudotime analysis. The selected nodes are in dark gray
Once you have identified all the root nodes, push the Calculate pseudotime button in the Selection panel (Figure xxx).
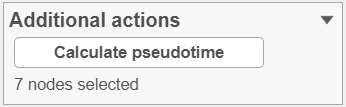 Figure 4. Once the root cell nodes are selected, use the Calculate pseudotime button to start the calculation. In this example, seven root nodes were specified
Additional Assistance
If you need additional assistance, please visit our support page to submit a help ticket or find phone numbers for regional support.


| Your Rating: |
|
Results: |

|
0 | rates |
Overview
Content Tools