Descriptive statistics task can be invoked on matrix data node e.g. gene counts, normalized counts data node in bulk RNA seq analysis pipeline or single cell counts data node etc. It calculates measures of central tendency and variability on observations or features of the matrix data.
Running Descriptive statistics
- Click on a counts data node
- Choose Descriptive Statistics in Pre-analysis tools section of the toolbox (Figure 1)
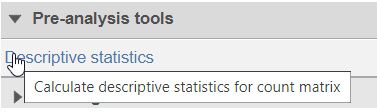
Figure 1. Descriptive statistics menu
This will invoke the dialog (Figure 2)

Figure 2. Select to calculate descriptive statistics on samples or cells
A second data node of a different type than the first selected data node is chosen automatically. The second data node can selected manually using the Select data node button.
- Click Select data node to choose the second data node you want to merge (Figure 1)
Figure 3. Opening the data node selector
- Double-click the second data node to select it (Figure 2)
 Figure 4. Choosing the second matrix
- Click Finish to run
A Merged counts data node is produced (Figure 3).
 Figure 5. Merged counts output
The intersection of observations (cells and/or samples) from the two input matrices is included in the merged matrix.
Figure 5. Merged counts output
The intersection of observations (cells and/or samples) from the two input matrices is included in the merged matrix.
Once two data types have been merged, they can be split using Split matrix.
For a practical example using Merge matrices, please see our tutorial on Analyzing CITE-Seq Data,
Additional Assistance
If you need additional assistance, please visit our support page to submit a help ticket or find phone numbers for regional support.


| Your Rating: |
|
Results: |

|
0 | rates |
Overview
Content Tools