What is Hurdle model?
Hurdle model is a statistical test for differential analysis that utilizes a two-part model, a discrete (logistic) part for modeling zero vs. non-zero counts and a continuous (log-normal) part for modeling the distribution of non-zero counts. In RNA-Seq data, this can be thought of as the discrete part modeling whether or not the gene is expressed and the continuous part modeling how much it is expressed if it is expressed. Hurdle model is well suited to data sets where features have very many zero values, such as single cell RNA-Seq data.
On default settings, Hurdle model is equivalent to MAST, a published differential analysis tool designed for single cell RNA-Seq data that uses a hurdle model [1].
Running Hurdle model
We recommend normalizing you data prior to running Hurdle model, but it can be invoked on any counts data node.
- Click the counts data node
- Click the Differential analysis section in the toolbox
- Click Hurdle model
- Select the factors and interactions to include in the statistical test (Figure 1)
Numeric and categorical attributes can be added as factors. To add attributes as factors, check the attribute check boxes and click Add interactions. To add interactions between attributes, click the attribute check boxes and click Add interaction.
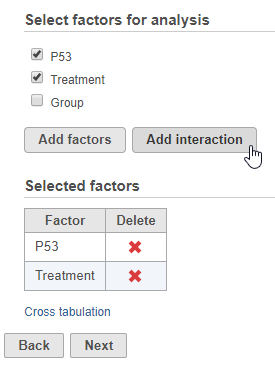 Figure 1. Adding factors to the statistical test
- Click Next
- Define comparisons between factor or interaction levels (Figure 2)
Adding comparisons in Hurdle model uses the same interface as ANOVA. Start by choosing a factor or interaction from the Factor drop-down list. The levels of the factor or interaction will appear in the left-hand panel. Select levels in the panel on the left and click the > arrow buttons to add them to the top or bottom panels on the right. The control level(s) should be added to the bottom box and the experimental level(s) should be added to the top box.
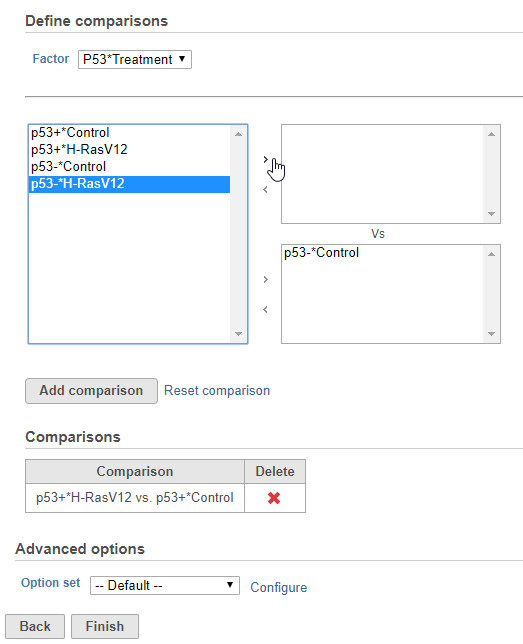 Figure 2. Adding comparisons
References
[1] Finak, G., McDavid, A., Yajima, M., Deng, J., Gersuk, V., Shalek, A. K., ... & Linsley, P. S. (2015). MAST: a flexible statistical framework for assessing transcriptional changes and characterizing heterogeneity in single-cell RNA sequencing data. Genome biology, 16(1), 278.
Additional Assistance
If you need additional assistance, please visit our support page to submit a help ticket or find phone numbers for regional support.


| Your Rating: |
|
Results: |

|
0 | rates |
Overview
Content Tools