What is Hurdle model?
Hurdle model is a statistical test for differential analysis that utilizes a two-part model, a discrete (logistic) part for modeling zero vs. non-zero counts and a continuous (log-normal) part for modeling the distribution of non-zero counts. In RNA-Seq data, this can be thought of as the discrete part modeling whether or not the gene is expressed and the continuous part modeling how much it is expressed if it is expressed. Hurdle model is well suited to data sets where features have very many zero values, such as single cell RNA-Seq data.
On default settings, Hurdle model is equivalent to MAST, a published differential analysis tool designed for single cell RNA-Seq data that uses a hurdle model [1].
Running Hurdle model
We recommend normalizing you data prior to running Hurdle model, but it can be invoked on any counts data node.
- Click the counts data node
- Click the Differential analysis section in the toolbox
- Click Hurdle model
- Select the factors and interactions to include in the statistical test (Figure 1)
Numeric and categorical attributes can be added as factors. To add attributes as factors, check the attribute check boxes and click Add interactions. To add interactions between attributes, click the attribute check boxes and click Add interaction.
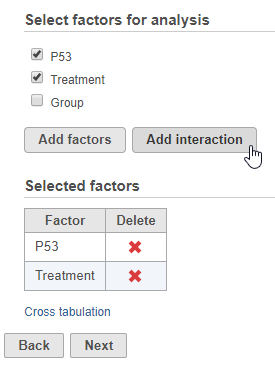 Figure 1. Adding factors to the statistical test
- Click Next
- Define comparisons between factor or interaction levels (Figure 2)
Adding comparisons in Hurdle model uses the same interface as ANOVA/LIMMA-trend/LIMMA-voom. Start by choosing a factor or interaction from the Factor drop-down list. The levels of the factor or interaction will appear in the left-hand panel. Select levels in the panel on the left and click the > arrow buttons to add them to the top or bottom panels on the right. The control level(s) should be added to the bottom box and the experimental level(s) should be added to the top box. Click Add comparison to add the comparison to the Comparisons table. Only comparisons in the Comparisons table will be included in the statistical test.
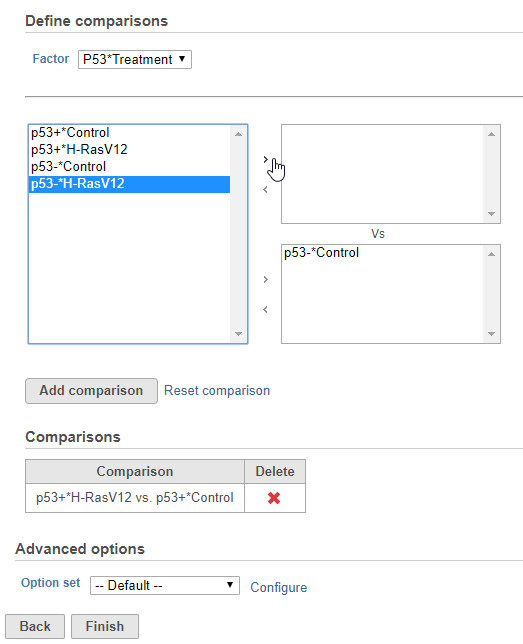 Figure 2. Adding comparisons
- Click Finish to run the statistical test
Hurdle model produces a Feature list task node. The results table and options are the same as the GSA task report except the last two columns (Figure 3). The percentage of cells where the feature is detected (value is above the background threshold) in different groups (Pct(group1), Pct(group2)) are calculated and included in the Hurdle model report.
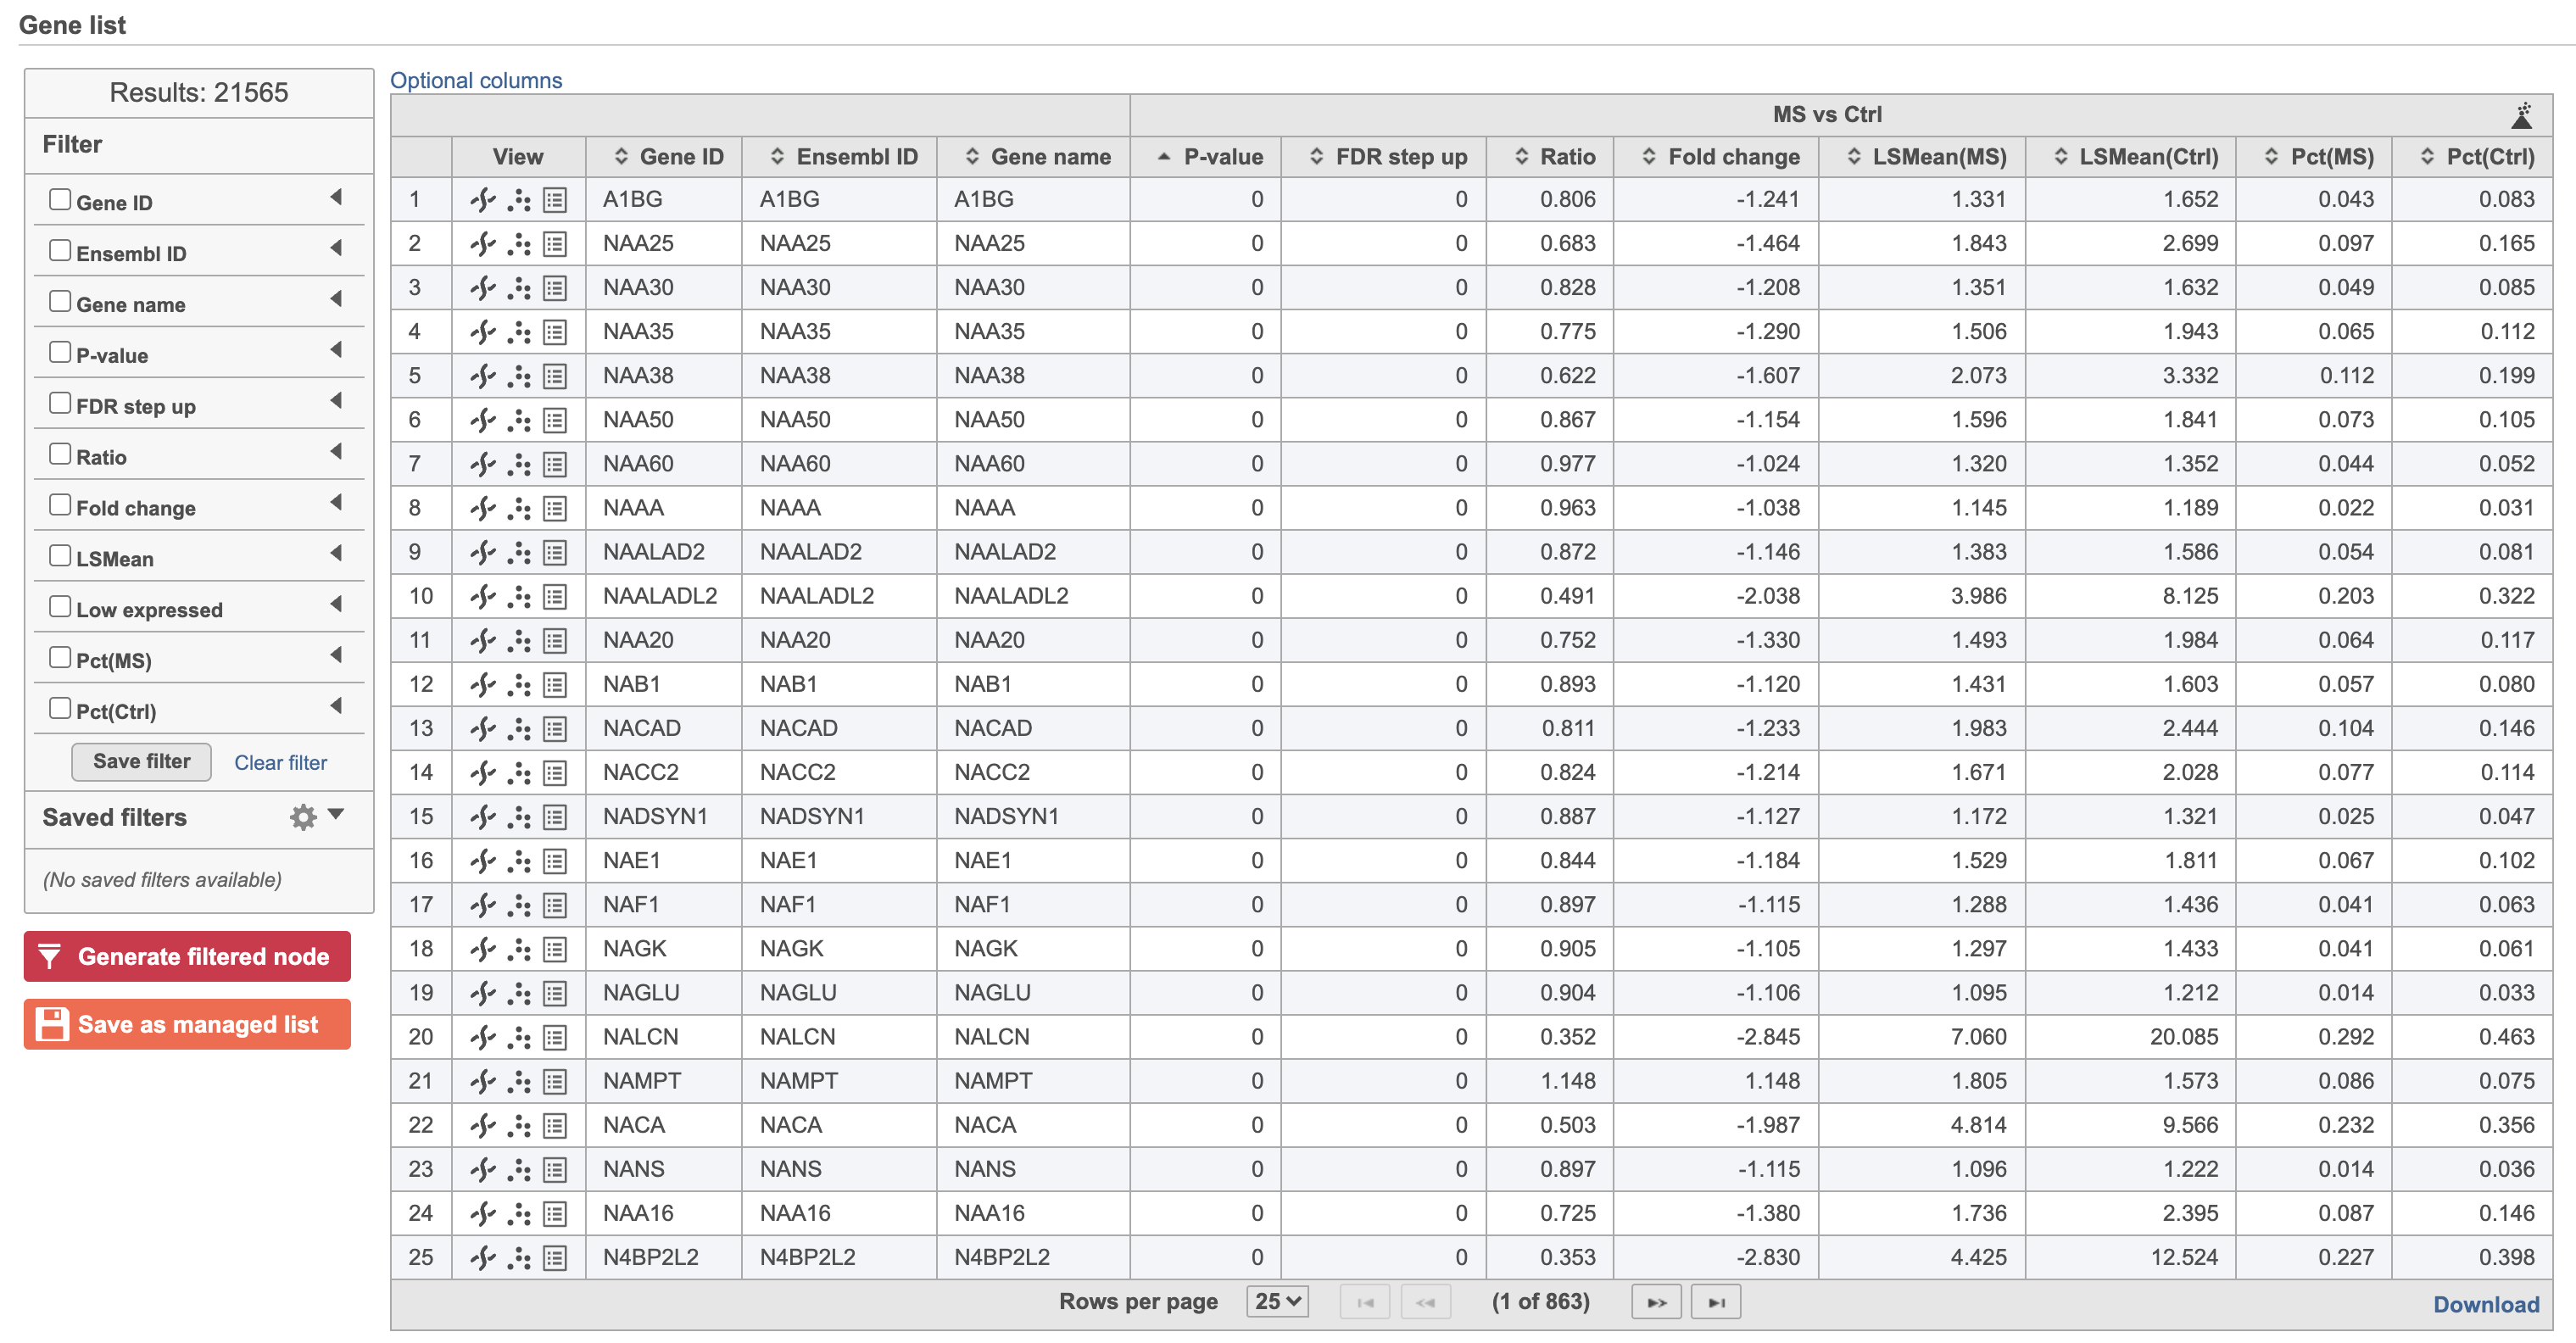 Figure 3. Hurdle model task report
Hurdle model advanced options
Low value filter
Low-value filter allows you to specify criteria to exclude features that do not meet requirements for the calculation. If there is filter feature task performed in the upstream analysis, the default of this filter is set to None, otherwise, the default is Lowest average coverage is set to 1.
Lowest average coverage: the computation will exclude a feature if its geometric mean across all samples is below than the specified value
Lowest maximum coverage: the computation will exclude a feature if its maximum across all samples is below the specified value
Minimum coverage: the computation will exclude a feature if its sum across all samples is below than the specified value
None: include all features in the computation
Multiple test correction
Multiple test correction can be performed on the p-values of each comparison, with FDR step-up being the default. If you check the Storey q-value, an extra column with q-values will be added to the report.
Use only reliable estimation results
There are situations when a model estimation procedure does not fail outright, but still encounters some difficulties. In this case, it can even generate p-value and fold change on the comparisons, but they are not reliable, i.e. they can be misleading. Therefore, the default of Use only reliable estimation results is set Yes.
Data has been transformed with log base
Shows the current scale of the input data for this task
Background expression level
Set the threshold for a feature to be considered expressed for the two-part hurdle model. If the feature value is greater than the specified value, it is considered expressed. If the upstream data node contains log-transformed values, be sure to specify the value on the same log scale. Default value is 0.
Shrinkage of error term variance
Applies shrinkage to the error variance in the continuous (log-normal) part of the hurdle model. The error term variance will be shrunk towards a common value and a shrinkage plot will be produced on the task report page if enable. Default is Enabled.
Shrinkage of regression coefficients
Applies shrinkage to the regression coefficients in the discrete (logistic) part of the hurdle model. The initial versions of MAST contained a bug that was fixed in its R source in March 2020. However, for the sake of reproducibility the fix was released only on a topic branch in MAST Github [2] and the default version of MAST remained as is. To install the fixed version of MAST in R, run the following R script.
# Uninstall the default version of MAST, if it's installed.
remove.packages("MAST")
# Install devtools, if it's not installed yet.
library("devtools")
install_github("https://github.com/RGLab/MAST/tree/fix/bayesglm")
library(MAST)
In Flow, the user can switch between the fixed and default version by selecting Fixed version or Default version, respectively. To disable the shrinkage altogether, choose Disabled.
References
[1] Finak, G., McDavid, A., Yajima, M., Deng, J., Gersuk, V., Shalek, A. K., ... & Linsley, P. S. (2015). MAST: a flexible statistical framework for assessing transcriptional changes and characterizing heterogeneity in single-cell RNA sequencing data. Genome biology, 16(1), 278.
[2] MAST topic branch that contains the regression coefficient shrinkage fix:
https://github.com/RGLab/MAST/tree/fix/bayesglm
Additional Assistance
If you need additional assistance, please visit our support page to submit a help ticket or find phone numbers for regional support.


| Your Rating: |
|
Results: |

|
13 | rates |
Overview
Content Tools