The Cell barcode QA/QC task lets you determine whether a given cell barcode is associated with a cell. This is an important QC step in all droplet-based single cell RNA-seq experiments, such as Drop-seq, where all barcodes are sequenced.
To invoke Cell barcode QA/QC:
- Click a Single cell counts data node
- Click the QA/QC section of the task menu
- Click Cell barcode QA/QC
The Cell barcode QA/QC task report is a plot (Figure 1). Barcodes are ordered on the X-axis by the number reads such that the barcode closest to the Y-axis has the most reads and the barcode furthest from the Y-axis has the fewest reads. The Y-axis value is the number of mapped reads corresponding to each barcode. This type of plot is often referred to as a knee plot.
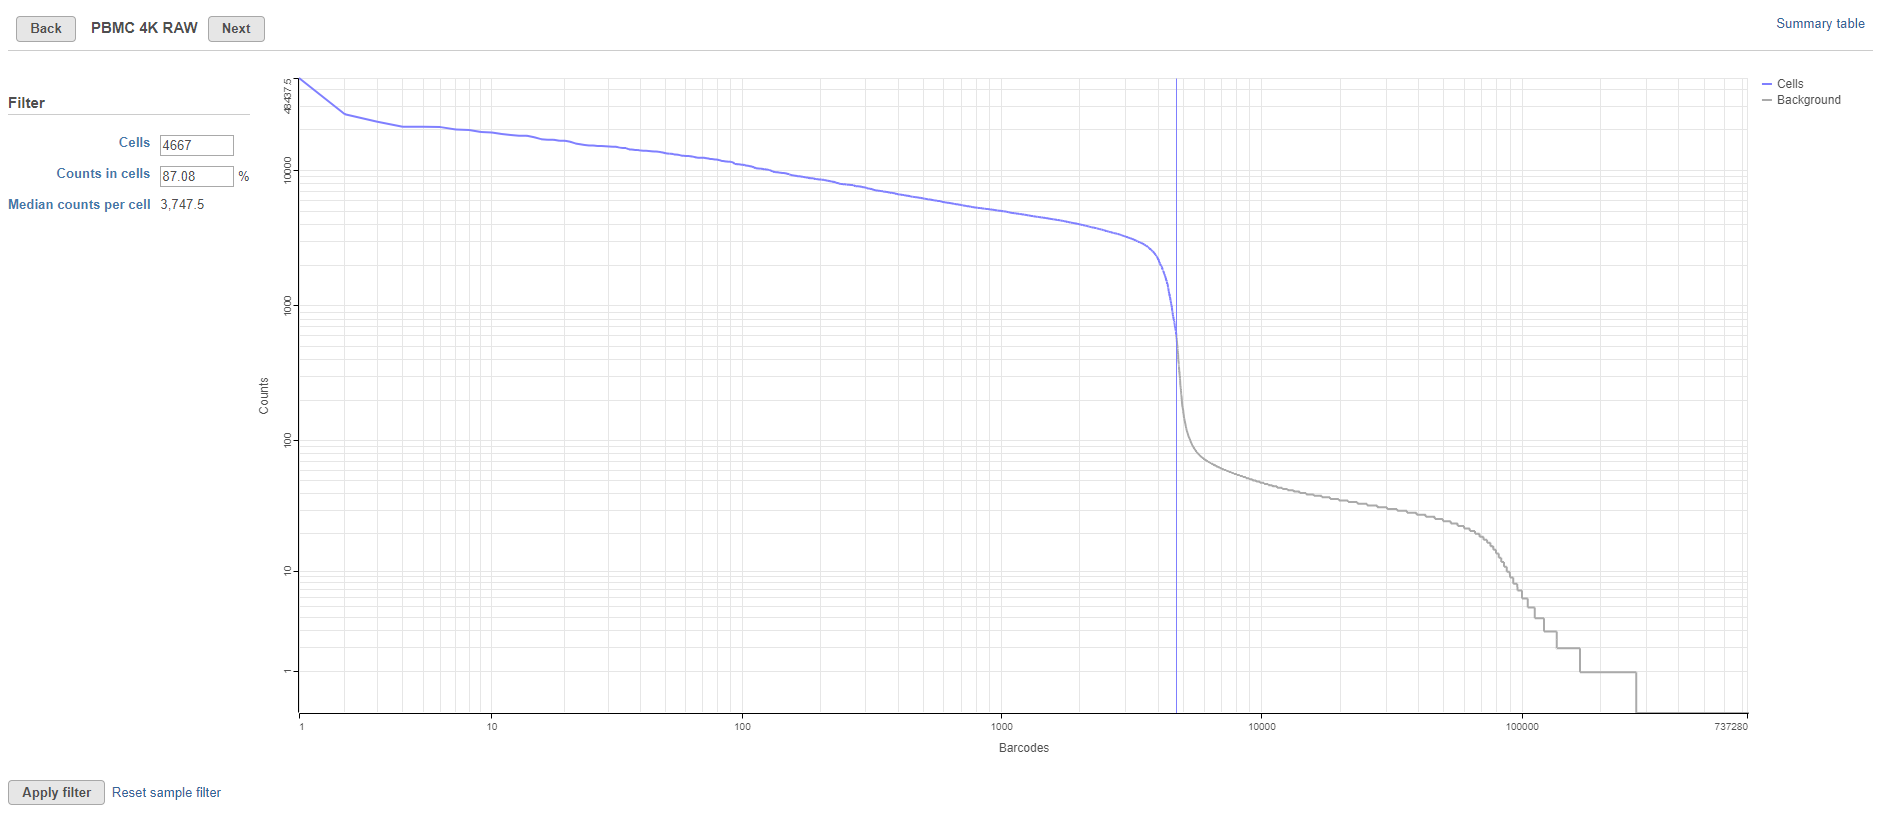 Figure 1. Cell barcode QA/QC task report is used to filter barcodes
The knee plot is used to choose a cutoff point between barcodes that correspond to cells and barcodes that do not. Partek Flow automatically calculates a cutoff point, shown by the vertical line on the graph. Barcodes designated as cells are shown in blue while barcodes designated as without cells (background) are shown in grey.
Figure 1. Cell barcode QA/QC task report is used to filter barcodes
The knee plot is used to choose a cutoff point between barcodes that correspond to cells and barcodes that do not. Partek Flow automatically calculates a cutoff point, shown by the vertical line on the graph. Barcodes designated as cells are shown in blue while barcodes designated as without cells (background) are shown in grey.
The cutoff can be adjusted by dragging the vertical line across the graph or by using the text fields in the Filter panel on the left-hand side of the plot. Using the Filter panel, you can specify the number of cells or the percentage of reads in cells and the cutoff point will be adjusted to match your criteria. The number of cells and the percentage of counts in cells is adjusted as the cutoff point is changed. To return to the automatically calculated cutoff, click Reset sample filter.
The percentage of counts in cells and median counts per cell are useful technical quality metrics that can be consulted when optimizing sample handling, cell isolation techniques, and library preparation.
One knee plot is generated for each sample. In projects with multiple samples, Next and Back buttons will appear at the top to enable navigation between sample knee plots. Manual filters must be set separately for each sample.
To view a summary of the currently selected filter settings for all samples, click Summary table. This opens a table showing key metrics for each sample in the project (Figure 2).
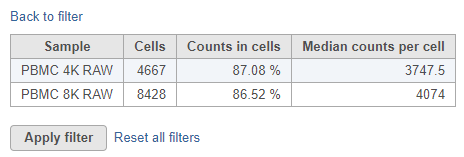
Figure 2. Barcode QA/QC summary table lists filtering information for each sample
To return to the knee plot view, click Back to filter. To apply the filter and run the Filter barcodes task, click Apply filter. A Filtered counts data node will be generated.
Additional Assistance
If you need additional assistance, please visit our support page to submit a help ticket or find phone numbers for regional support.


| Your Rating: |
|
Results: |

|
14 | rates |
Overview
Content Tools