The Cell barcode QA/QC task lets you determine whether a given cell barcode is associated with a cell. This is an important QC step in all droplet-based single cell RNA-seq experiments, such as Drop-seq, where all barcodes are sequenced.
To invoke Cell barcode QA/QC:
- Click a Single cell counts data node
- Click the QA/QC section of the task menu
- Click Cell barcode QA/QC
The task can be performed with or without the EmptyDrops method enabled.
Cell Barcode QA/QC without EmptyDrops
To perform the task without the EmptyDrops method enabled, leave the checkbox unchecked and click Finish (Figure 1).
 Figure 1. Leave the checkbox unchecked to run the task without the EmptyDrops method
The Cell barcode QA/QC task report is a plot (Figure 2). Barcodes are ordered on the X-axis by the number reads such that the barcode closest to the Y-axis has the most reads and the barcode furthest from the Y-axis has the fewest reads. The Y-axis value is the number of mapped reads corresponding to each barcode. This type of plot is often referred to as a knee plot.
Figure 1. Leave the checkbox unchecked to run the task without the EmptyDrops method
The Cell barcode QA/QC task report is a plot (Figure 2). Barcodes are ordered on the X-axis by the number reads such that the barcode closest to the Y-axis has the most reads and the barcode furthest from the Y-axis has the fewest reads. The Y-axis value is the number of mapped reads corresponding to each barcode. This type of plot is often referred to as a knee plot.
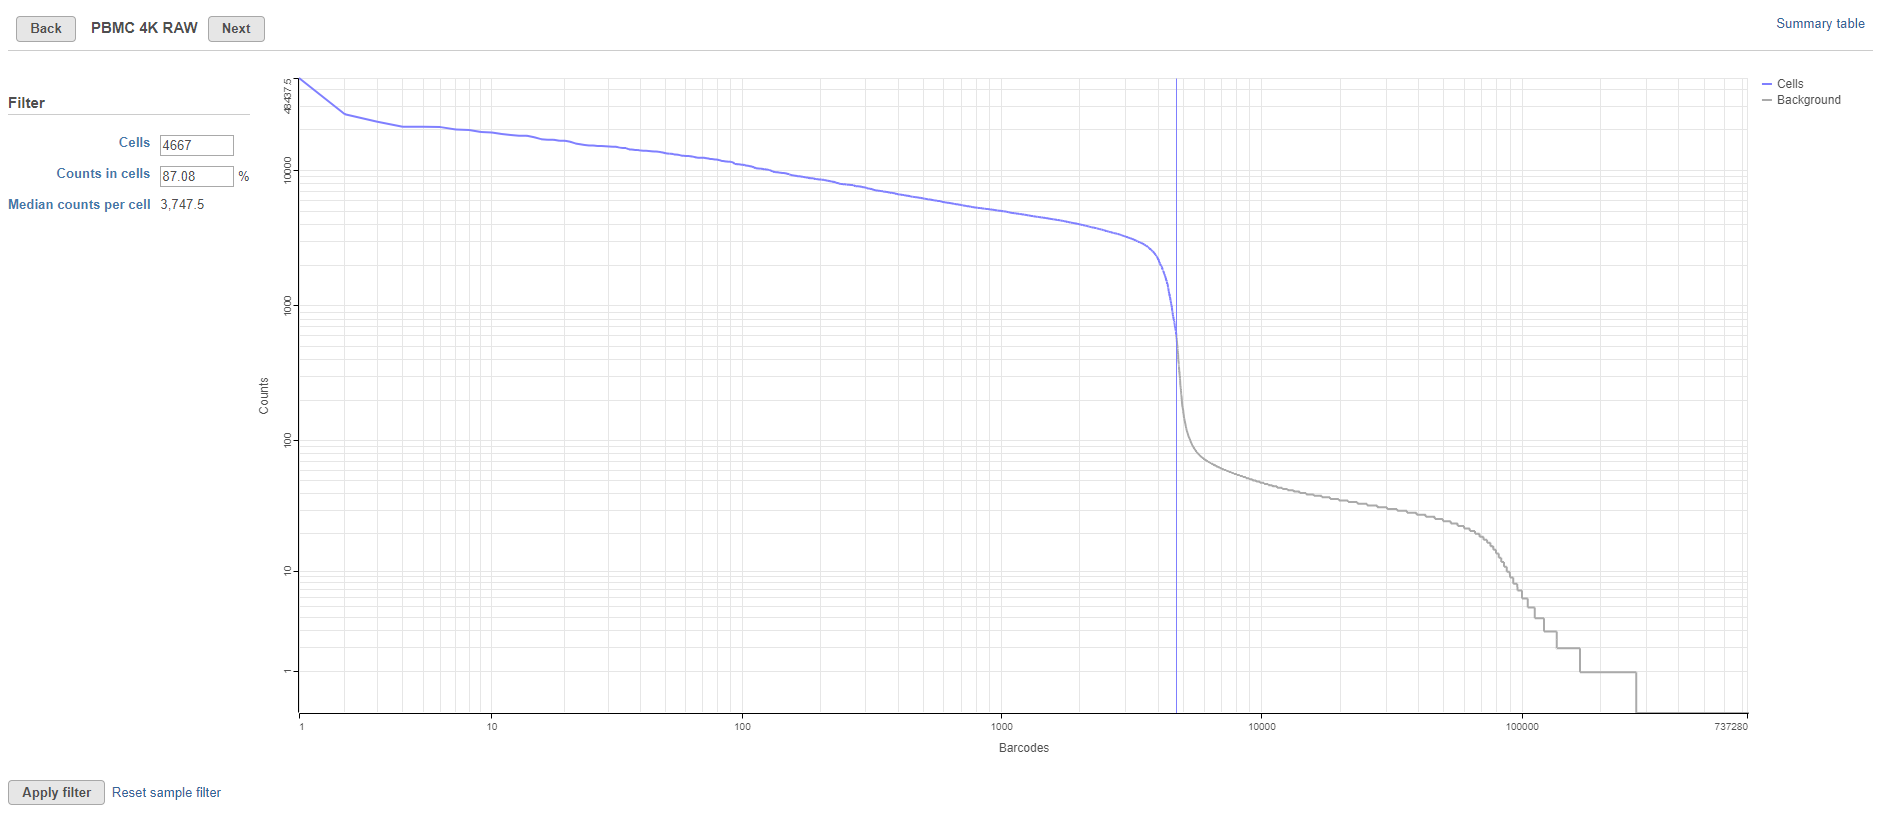 Figure 2. Cell barcode QA/QC task report is used to filter barcodes
The knee plot is used to choose a cutoff point between barcodes that correspond to cells and barcodes that do not. Partek Flow automatically calculates an inflection point, shown by the vertical line on the graph. Barcodes designated as cells are shown in blue while barcodes designated as without cells (background) are shown in grey.
Figure 2. Cell barcode QA/QC task report is used to filter barcodes
The knee plot is used to choose a cutoff point between barcodes that correspond to cells and barcodes that do not. Partek Flow automatically calculates an inflection point, shown by the vertical line on the graph. Barcodes designated as cells are shown in blue while barcodes designated as without cells (background) are shown in grey.
The cutoff can be adjusted by dragging the vertical line across the graph or by using the text fields in the Filter panel on the left-hand side of the plot. Using the Filter panel, you can specify the number of cells or the percentage of reads in cells and the cutoff point will be adjusted to match your criteria. The number of cells and the percentage of counts in cells is adjusted as the cutoff point is changed. To return to the automatically calculated cutoff, click Reset sample filter.
The percentage of counts in cells and median counts per cell are useful technical quality metrics that can be consulted when optimizing sample handling, cell isolation techniques, and library preparation.
One knee plot is generated for each sample. In projects with multiple samples, Next and Back buttons will appear at the top to enable navigation between sample knee plots. Manual filters must be set separately for each sample. This is typically used when the user expects a certain number of cells to be processed, like in experiments where droplets were loaded with a predefined number of cells.
To view a summary of the currently selected filter settings for all samples, click Summary table. This opens a table showing key metrics for each sample in the project (Figure 3).
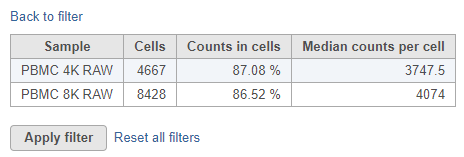
Figure 3. Barcode QA/QC summary table lists filtering information for each sample
To return to the knee plot view, click Back to filter. To apply the filter and run the Filter barcodes task, click Apply filter. A Filtered counts data node will be generated.
Cell Barcode QA/QC with EmptyDrops
The EmptyDrops method (1) uses a statistical test to identify which barcodes correspond to real cells and empty droplets. An ambient RNA expression profile is estimated from barcodes below a specified total UMI count threshold, using the Good-Turing algorithm. The expression profile of each barcode above the low-count threshold is then tested for deviations from the ambient profile. Real cells are expected to have a low p-value, indicating a significant deviation from the expected background noise level. False discovery rate (FDR) correction is applied to all the p-values and those falling equal to or below the specified FDR level are detected as real cells. This can allow for the detection of additional cells that would otherwise be discarded due to a low total UMI count.
This method requires empty barcodes to be present in the single cell count matrix, in order to estimate the ambient RNA profile. If your data has already been filtered to remove barcodes with low total counts, this method will not be suitable. For example, if you are working with 10X Genomics data, the EmptyDrops method can only be run on the raw counts, not the filtered counts.
In addition, a knee point threshold will be calculated to identify cells with a very high total UMI count. It's possible that some barcodes with a high total UMI count will not pass the EmptyDrops significance test. This could be due to biases in the ambient RNA profile, leading to a non-significant difference between a barcode's expression profile vs the ambient profile. To protect against this issue, it is advisable to use the EmptyDrops results in conjunction with the knee point filter, on the assumption that barcodes with a very high total UMI count will always correspond to real cells. Note, the knee point will be more conservative than the inflection point calculated by Partek Flow when the EmptyDrops method is not enabled.
To perform the task with the EmptyDrops method, check the checkbox, configure the additional options, and click Finish (Figure 4)
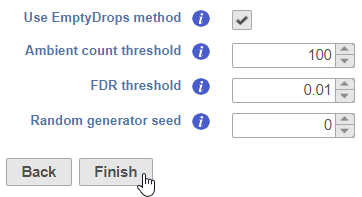 Figure 4. Check the box to run the task with the EmptyDrops method and configure the other settings
Ambient count threshold
Figure 4. Check the box to run the task with the EmptyDrops method and configure the other settings
Ambient count threshold
Barcodes with a total UMI count equal to or below this threshold will be used to create the ambient RNA expression profile to estimate background noise. The default is set to 100, which is reasonable for most data.
FDR threshold
Barcodes equal to or below this FDR threshold show a significant deviation from the ambient profile and can therefore be considered real cells. Increasing this value will result in more cells, but will also increase the number of potential false positives.
Random generator seed
This is used for performing Monte Carlo simulations to determine p-values. To reproduce results, use the same random seed for all runs.
The task report will appear similar to Figure 2, with additional metrics on the left (Figure 5).
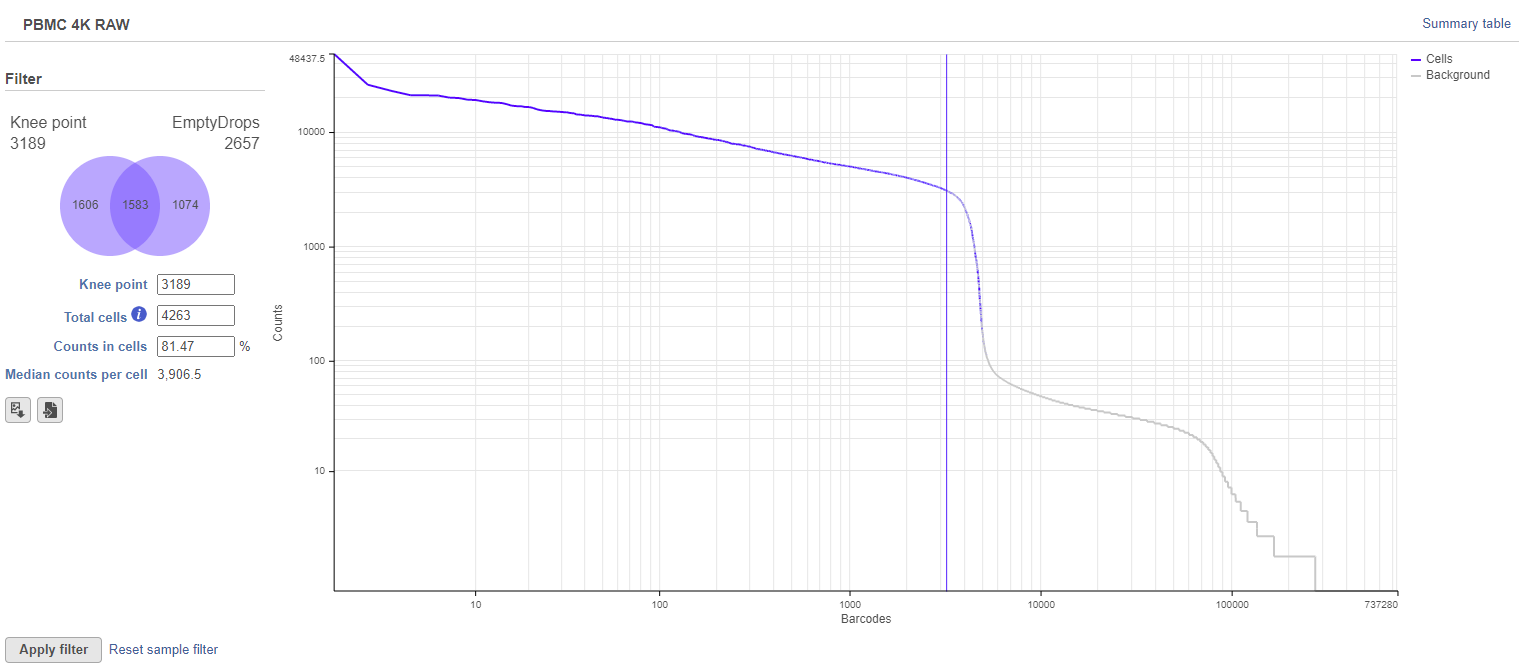 Figure 5. Cell barcode QA/QC task report with EmptyDrops enabled
The number of actual cells detected by the EmptyDrops test and the knee point filter are shown above the Venn diagram on the left. In Figure 5, 3,189 barcodes are above the knee point filter (represented by the vertical blue line on the plot) and 2,657 barcodes passed the significance test in EmptyDrops. The overlap between these sets of barcodes is represented by the Venn diagram. In Figure 5, 1,583 barcodes pass the significance test in EmptyDrops and have a high total UMI count above the knee point filter; 1,606 barcodes have a very high total UMI count with no significant difference from the ambient profile in EmptyDrops; 1,074 barcodes fall below the knee point but are still significantly different from the ambient profile.
Figure 5. Cell barcode QA/QC task report with EmptyDrops enabled
The number of actual cells detected by the EmptyDrops test and the knee point filter are shown above the Venn diagram on the left. In Figure 5, 3,189 barcodes are above the knee point filter (represented by the vertical blue line on the plot) and 2,657 barcodes passed the significance test in EmptyDrops. The overlap between these sets of barcodes is represented by the Venn diagram. In Figure 5, 1,583 barcodes pass the significance test in EmptyDrops and have a high total UMI count above the knee point filter; 1,606 barcodes have a very high total UMI count with no significant difference from the ambient profile in EmptyDrops; 1,074 barcodes fall below the knee point but are still significantly different from the ambient profile.
The number of cells included by the knee point filter can be adjusted either by click on the plot to change the position of the vertical blue line or by typing a different number of cells into the text box on the left.
The total number of cells is shown in the text box on the left. By default, this will be all of the cells detected by the knee point filter plus the extra cells detected by EmptyDrops. In Figure 5, this means the 3,189 cells with a high total UMI count plus the additional 1,074 cells from EmptyDrops (total = 4,263).
Different sections of the Venn diagram can be selected/deselected to include/exclude barcodes. For example, in Figure 5, clicking the '1,606' section of the Venn diagram will deselect those barcodes. Now, the only cells that will pass the filter will be the significant ones from EmptyDrops (Figure 6).
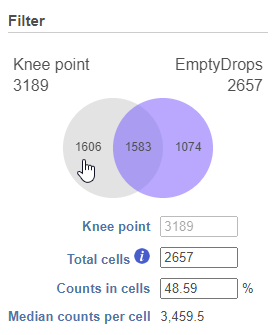 Figure 6. Click a section of the Venn diagram to deselect it. In this case, only the 2,657 cells that pass the EmptyDrops test will be included
References
- Lun, A., Riesenfeld, S., Andrews, T. et al. EmptyDrops: distinguishing cells from empty droplets in droplet-based single-cell RNA sequencing data. Genome Biol. 2019; 20: 63.
Additional Assistance
If you need additional assistance, please visit our support page to submit a help ticket or find phone numbers for regional support.


| Your Rating: |
|
Results: |

|
29 | rates |
Overview
Content Tools