By including Batch in the ANOVA model, the variability due to the batch effect is accounted for when calculating p-values for the non-random factors. In effect, the batch effect has already been removed. However, visualizing biological effects using tools like PCA and clustering can be very difficult if batch effects are present. We can modify the original intensity data to remove the batch effect using the Remove Batch Effect tool.
The Remove Batch Effect tool functions much like ANOVA in reverse, calculating the variation attributed to the effect being removed then adjusting the original intensity values to remove the effect. Once the effect has been removed, tools like PCA or clustering can be used to visualize what the data would look like if the batch effect was not present.
- Select the1 (Breast_Cancer.txt) spreadsheet
- Select Stat from the main tool bar
- Select Remove Batch Effect... (Figure 1)
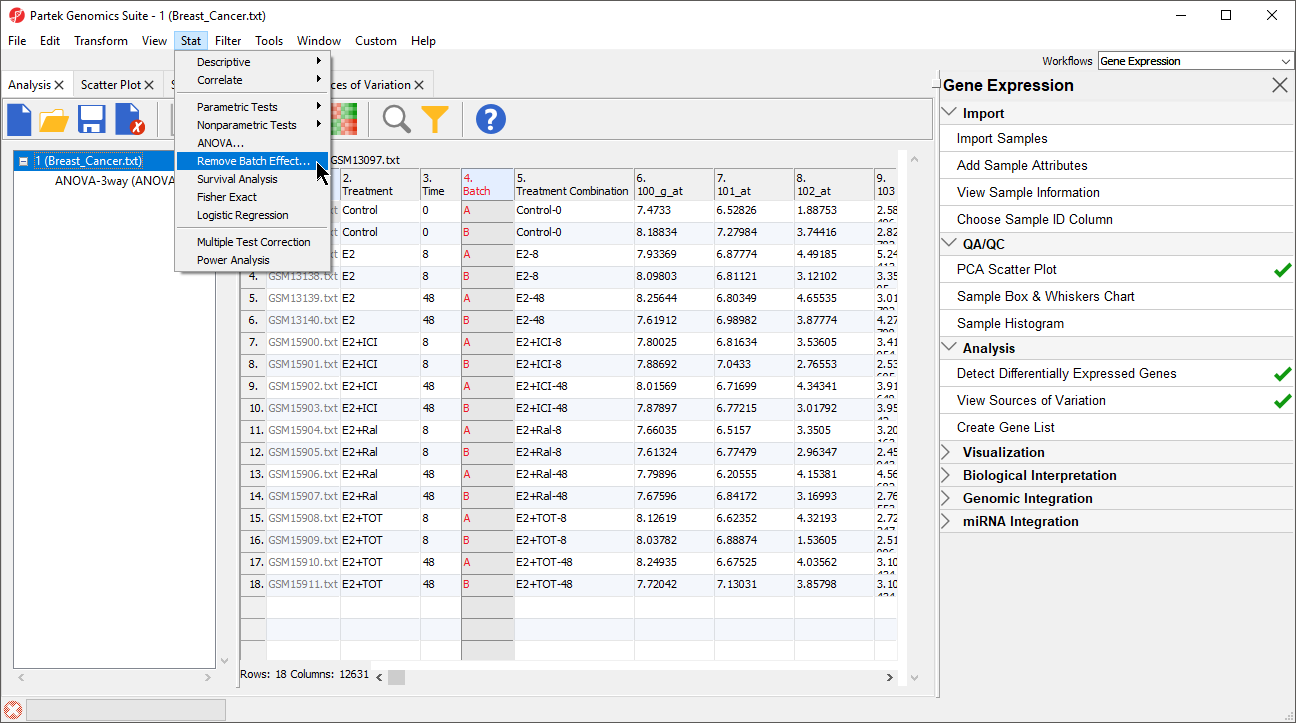
Figure 1. Invoking the Remove Batch Effect tool
The Remove Batch Effects dialog will open. The tool functions by performing an ANOVA then modifying the original intensities values to remove the effects of the specified factor(s).
- Select Treatment, Time, and Batch
- Select Add Factor > to add them to the ANOVA Factor(s) panel
- Select Batch in the ANOVA Factor(s) panel
- Select Add Factor > to add Batch to the Remove Effect(s) of These Factor(s) panel
By default, the results will be displayed in a new spreadsheet. Options to overwrite the current spreadsheet and specify the output file appear in the bottom of the dialog (Figure 2).
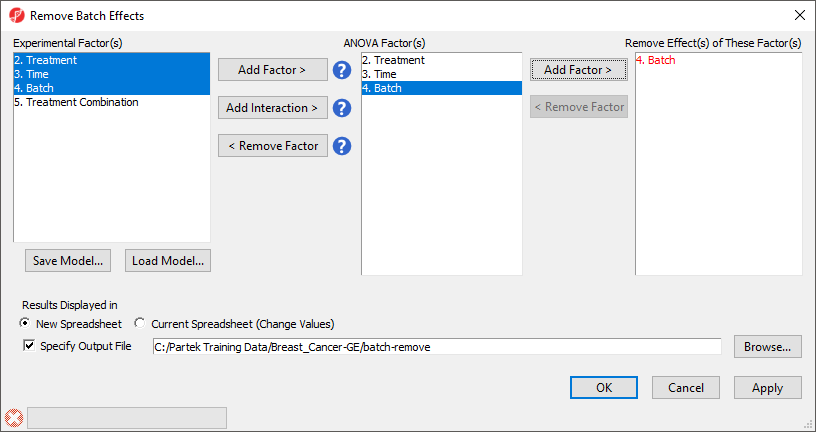
Figure 2. Configuring the Remove Batch Effects tool to remove Batch and create a new spreadsheet
- Select OK
The new spreadsheet, 1-removeresult (batch-remove) will open in the Analysis tab (Figure 3).
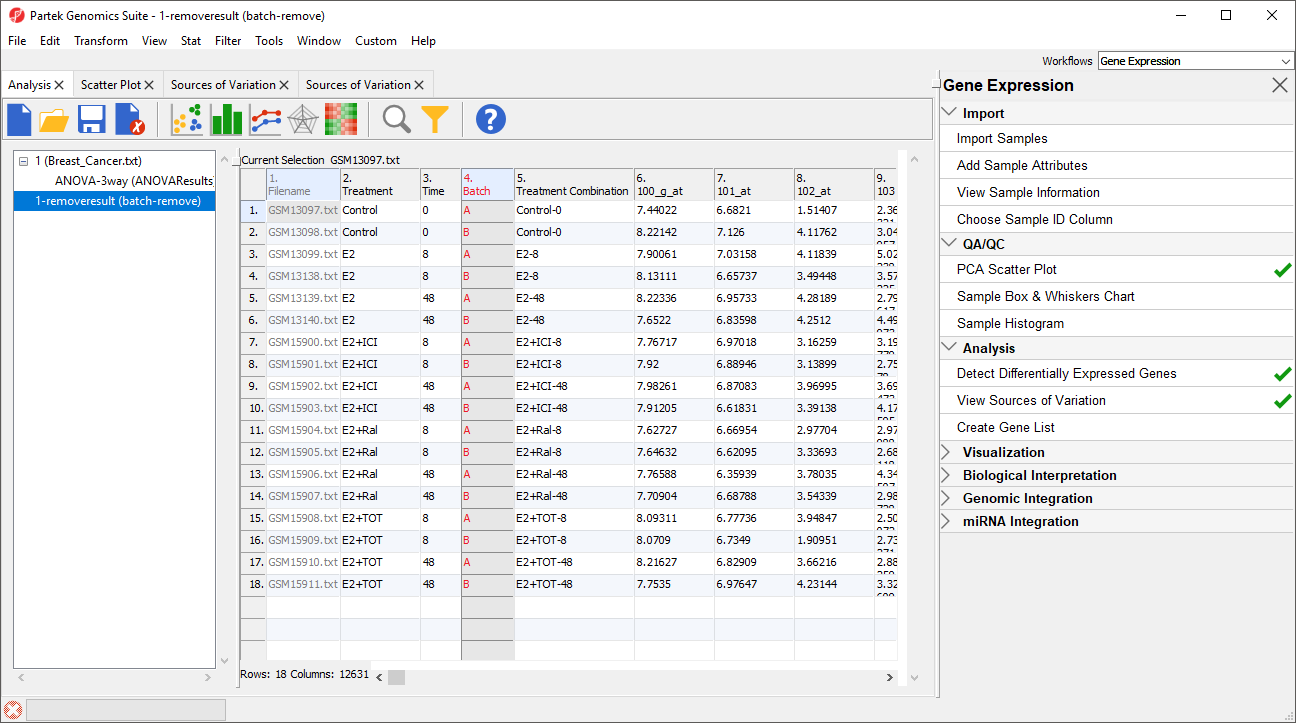 Figure 3. Viewing the new spreadsheet with batch effects removed
We can visualize the effects of removing the batch effects by plotting a PCA scatter plot.
Figure 3. Viewing the new spreadsheet with batch effects removed
We can visualize the effects of removing the batch effects by plotting a PCA scatter plot.
- Select (
 ) plot the PCA scatter plot
 - Select (
 )
) - Set Drawing Mode to Mixed
- Select the Ellipsoids tab
- Select Add Centroid
- Add Batch to the Grouping Variable(s) panel
- Set the colors of the two centroids as shown (Figure 4) to pink and yellow
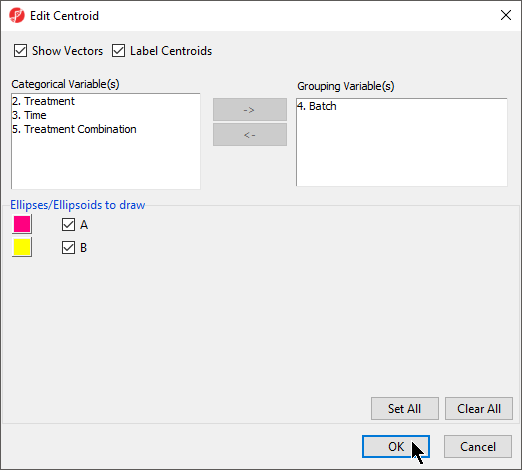
Figure 4. Adding a centroid for Batch
- Select OK to close the Add Centroid...
- Select OK to close the Configure Plot Properties dialog
The centroids of the two batches overlap, showing that the batch effect has been removed (Figure 5).

Figure 5. Overlapping centroids for batches A and B show that the batch effect has been removed.
Additional Assistance
If you need additional assistance, please visit our support page to submit a help ticket or find phone numbers for regional support.


| Your Rating: |
|
Results: |

|
0 | rates |
Overview
Content Tools