To detect differential methylation between CpG loci in different experimental groups, we can perform an ANOVA test. For this tutorial, we will perform a simple one-way ANOVA to compare the methylation states of the four experimental groups.
- Select Defect Differential Methylation from the Analysis section of the Illumina BeadArray Methylation workflow
- Select 2. Cell Type from the Experimental Factor(s) panel
- Select Add Factor > to move 2. Cell Type to the ANOVA Factor(s) panel (Figure 1)
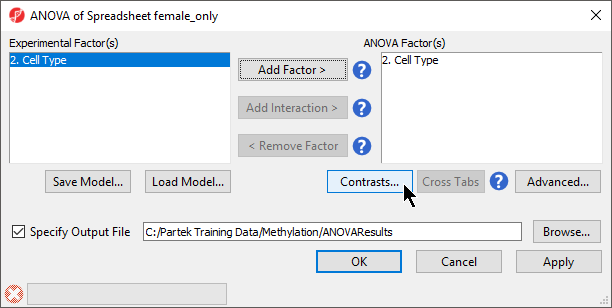 Figure 1. ANOVA setup dialog. Experimental factors listed on the left can be added to the ANOVA model.
- Select Contrasts...
- Select Yes for Data is already log transformed? because M-values are based on logit transformation
- Select LCLs
- Select Add Contrast Level > for the upper group
- Select B cells
- Select Add Contrast Level > for the lower group
- Select the Estimate box in the Other Statistics section of the Configure dialog (Figure 2)
- Select Add Contrast
By default, the fold-change value for each contrast will be calculated with the upper group as the numerator and the lower group as the denominator. Selecting Estimate will also include the difference in methylation levels between the groups at each CpG site in the output. These values will be needed later in the tutorial.
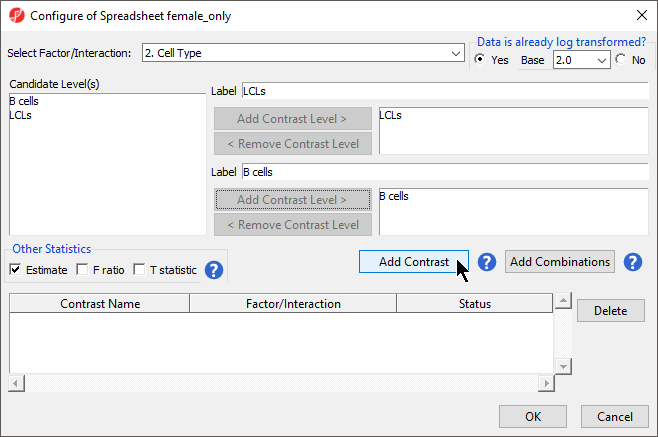
Figure 2. Configuring ANOVA contrasts
- Select OK to close the Configuration dialog
The Contrasts... button of the ANOVA dialog now reads Contrasts Included
- Select OK to close the ANOVA dialog and run the ANOVA
If this is the first time you have analyzed a MethylationEPIC array using the Partek Genomics Suite software, the manifest file may need to be configured. If it needs configuration, the Configure Annotation dialog will appear (Figure 3).
- Select Chromosome is in one column and the physical location is in another column for Choose the column configuration
- Select Ilmn ID for Marker ID
- Select CHR for Chromosome i
- Select MAPINFO for Physical Position
- Select Close
This enables Partek Genomics Suite to parse out probe annotations from the manifest file.
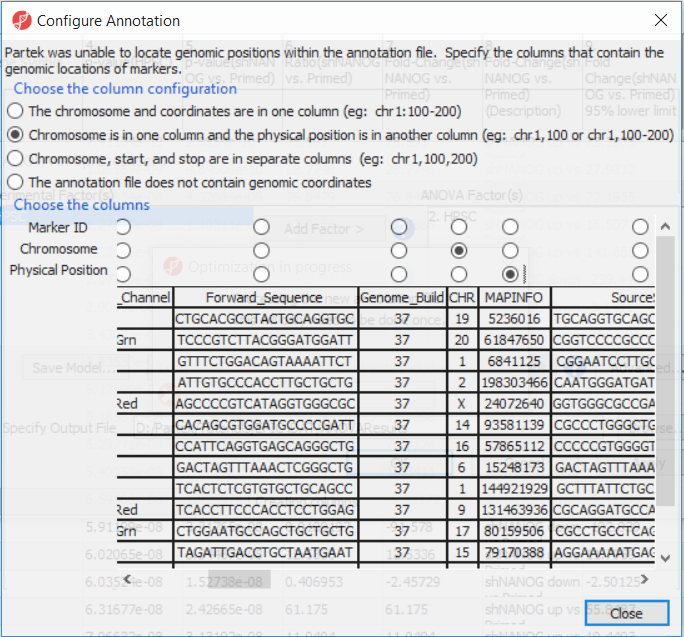 Figure 3. Processing the annotation file. User needs to point to the columns of the annotation file that contain the probe identifier as well as the chromosome and coordinates of the probe.
The results will appear as ANOVA-1way (ANOVAResults), a child spreadsheet of female_only. Each row of the spreadsheet represents a single CpG locus (identified by Column ID).
Figure 3. Processing the annotation file. User needs to point to the columns of the annotation file that contain the probe identifier as well as the chromosome and coordinates of the probe.
The results will appear as ANOVA-1way (ANOVAResults), a child spreadsheet of female_only. Each row of the spreadsheet represents a single CpG locus (identified by Column ID).
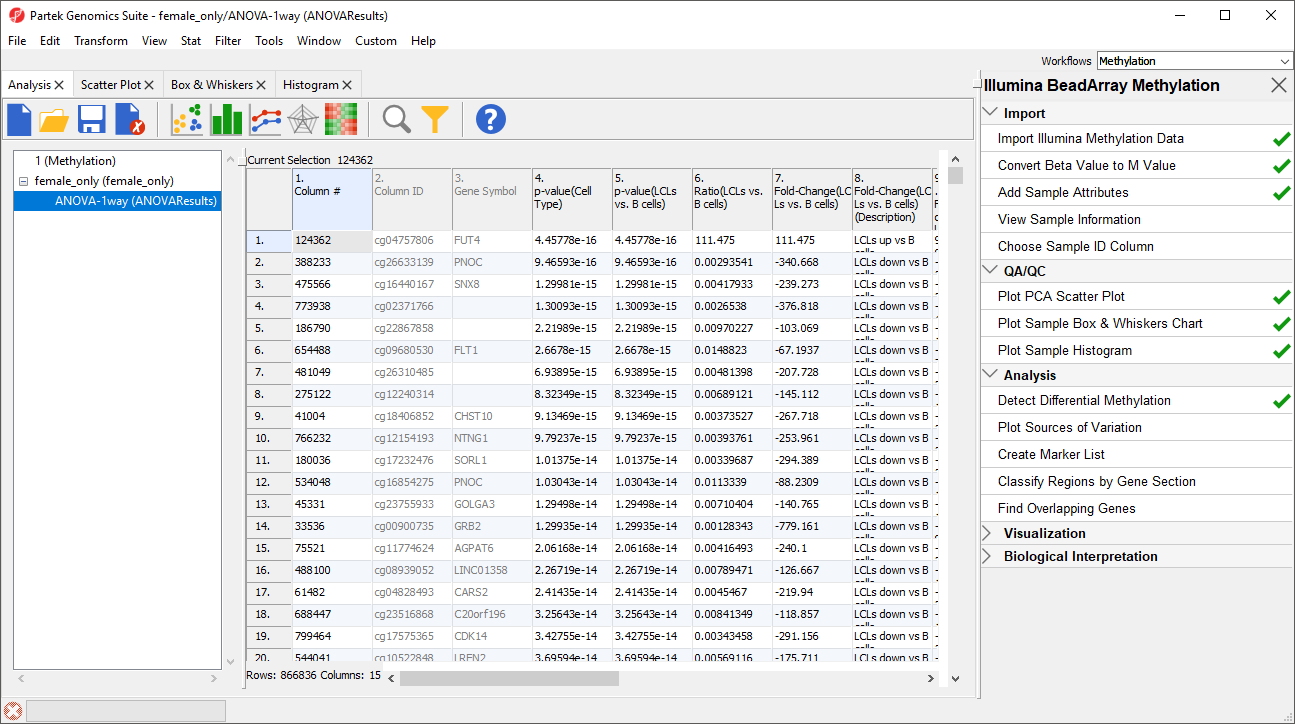 Figure 4. ANOVA spreadsheet (truncated). Each row is a result of an ANOVA at a given CpG locus (identified by the Column ID column). The remaining columns contain annotation and statistical output
Additional Assistance
If you need additional assistance, please visit our support page to submit a help ticket or find phone numbers for regional support.


| Your Rating: |
|
Results: |

|
1 | rates |
Overview
Content Tools