When looking for simple differential expression, sorting by ascending on the factor p-values is ideal. This will find groups that are the most significantly apart across all the contained genes. In the interest of finding groups that are less likely to be called by chance, it may be wise to filter to groups with a minimum of 4 or 5 genes (Figure 1). Simple filters can be done using the interactive filter (![]() ) available from the button on the toolbar at the top of the screen.
) available from the button on the toolbar at the top of the screen.
If there is more than one factor in the model, more complex criteria combining the factors can be specified using the gene list creator. The Create Gene List tool is available under the Analysis section of the workflow. For example, to find categories that are significant and changed by at least two fold, make two criteria, one for a low p-value and the other for a minimum of two fold change, and take the intersection of the two. This is the only way to analyze GO ANOVA if no factor is interacted with genes.
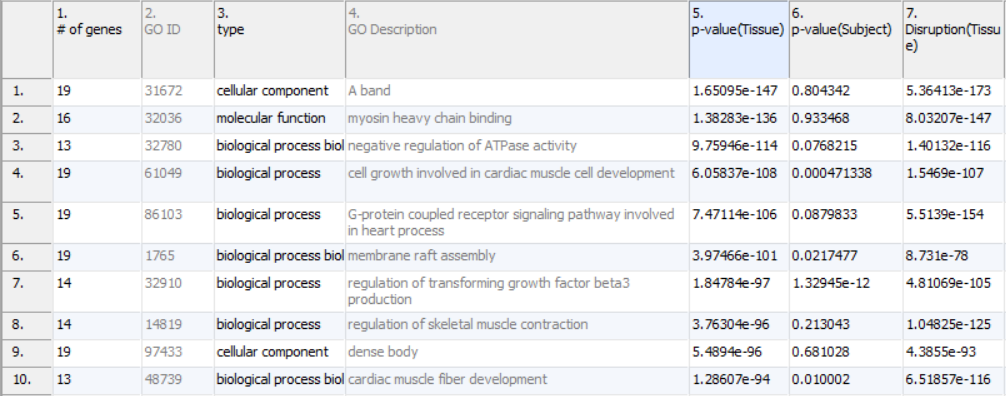 Figure 1. Top ten functional groups sorted by the Tissue p-value after filtering to a minimum five gene in the GO category. Note that most of the groups can be directly related to the heart muscle
Additional Assistance
If you need additional assistance, please visit our support page to submit a help ticket or find phone numbers for regional support.


| Your Rating: |
|
Results: |

|
0 | rates |
Overview
Content Tools