When looking for simple differential expression, sorting by ascending on the factor p-values is ideal. This will find groups that are the most significantly apart across all the contained genes. In the interest of finding groups that are less likely to be called by chance, it may be wise to filter to groups with a minimum of 4 or 5 genes (Figure 1). Simple filters can be done using the interactive filter (![]() ) available from the button on the toolbar at the top of the screen.
) available from the button on the toolbar at the top of the screen.
If there is more than one factor in the model, more complex criteria combining the factors can be specified using Tools>List Manager menu Advanced tab. For example, to find categories that are significant and changed by at least two fold, make two criteria: one for a low p-value and the other for a minimum of two fold change, and take the intersection of the two criteria.
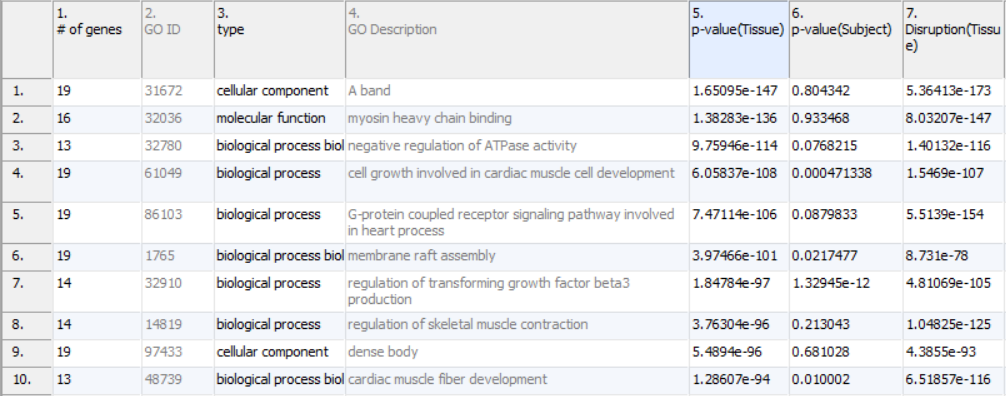
Figure 1. Top ten functional groups sorted by the Tissue p-value after filtering to a minimum five gene in the GO category. Note that most of the groups can be directly related to the heart muscle
If the disruption (factor*gene interaction) is tested, the filters can become more complicated. The most pressing need for complex filters is that when analyzing larger functional groups it is not expected that the entire functional group will behave the same. Looking back at Figure 1, notice how the low values in column 7 are present because not every gene is equally differentially expressed even in the most differentially expressed of groups. That is, when there is significant differential expression, it is likely that there will also be disruption as at least a single gene is likely participating in a role beyond that of the functional group and will not follow the pattern of the rest of the group. This situation is expected and leads to a new type of filter.
Filtering for low p-values on the factor and then filtering for low p-values on the factor interacted with gene will find groups that are differentially expressed, but contain at least a few genes that are either disrupted due to treatment, or simply are involved in additional functional groups beyond the scope of the one being analyzed. This list often contains some of the more informative big picture functional groups.
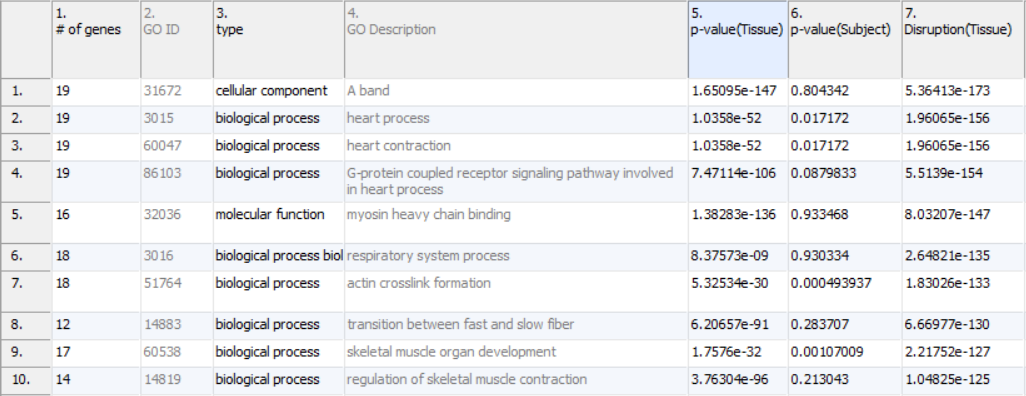 Figure 2. Top ten functional categories sorted by Disruption(Tissue) p-value after filtering to a minimum of five genes in the GO category. By prioritizing by the disruption column this type of a list is more "big picture"
If looking for disruption for groups which are not so much differentially expressed, but instead which express different genes for different treatments, filter for low disruption p-values but for high factor p-values. As shown by Figure 2, large or diverse groups that are differentially expressed will often exhibit significant disruption. In fact, a group that is differentially expressed but includes even a single gene that is not changed will have very significant disruption. These situations are certainly notable, but are distracting if looking for functional groups that instead are uniquely patterned based on treatment. By filtering out those groups with low p-values for the factor and then looking at the remaining groups with low p-values for disruption, groups observed have usually very distinct patterns of expression (Figure 3).
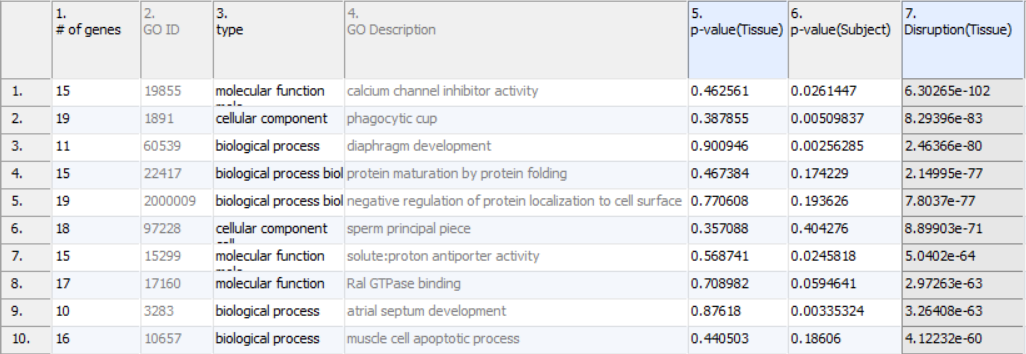 Figure 3. Top ten functional categories sorted by Disruption(Tissue) p-value after filtering to a minimum of five genes in the GO category and minimum Tissue p-value of 0.3. This list is especially interesting, as using enrichment alone to detect such categories would require a lot of labour.
Additional Assistance
If you need additional assistance, please visit our support page to submit a help ticket or find phone numbers for regional support.


| Your Rating: |
|
Results: |

|
33 | rates |
Overview
Content Tools