The next step of interpretation is creation of a list of genes overlapping with the differentially methylated CpG loci.
- Select Find Overlapping Genes... from the Tools section of the main toolbar (Figure 1)
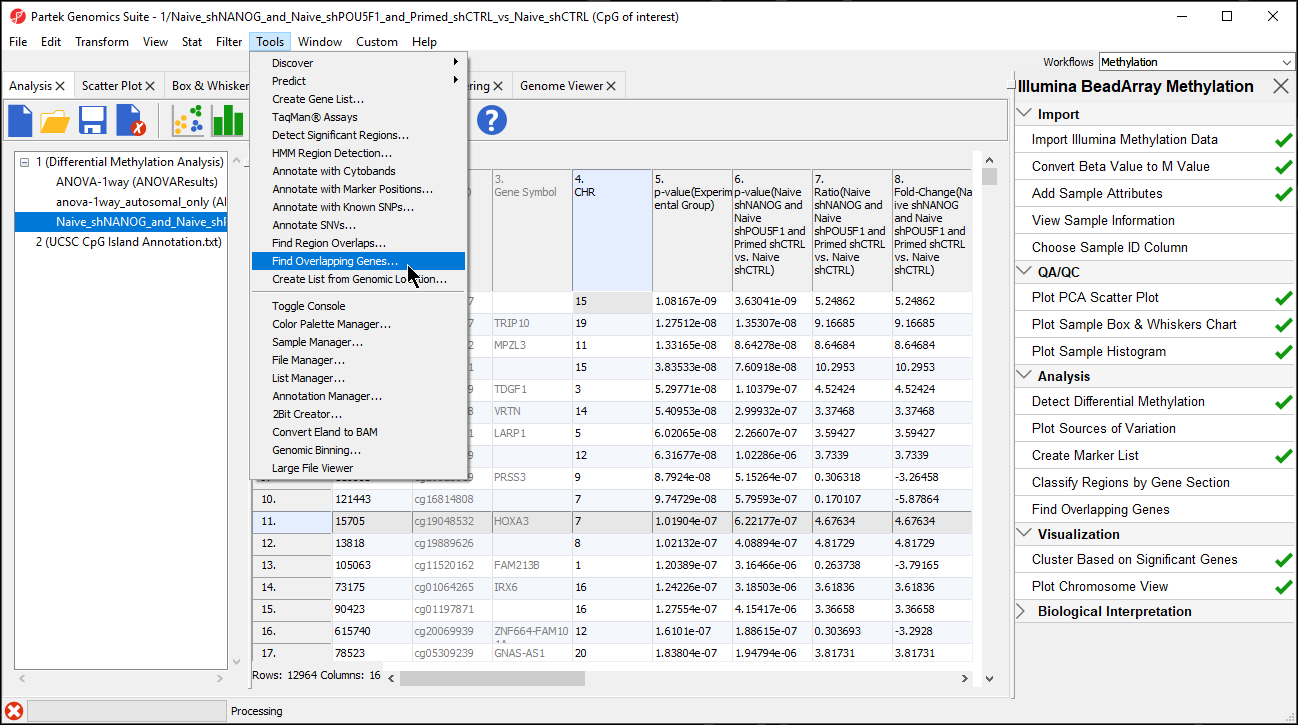 Figure 1. Selecting Finding Overlapping Genes form the main toolbar
- Select Create a new spreadsheet with genes that overlap with the regions in the Find Overlapping Genes dialog
- Select OK
- Select an annotation - this tutorial uses RefSeq Transcripts - 2014-01-03
- Select OK
A new spreadsheet will be created as a child spreadsheet (Figure 2)
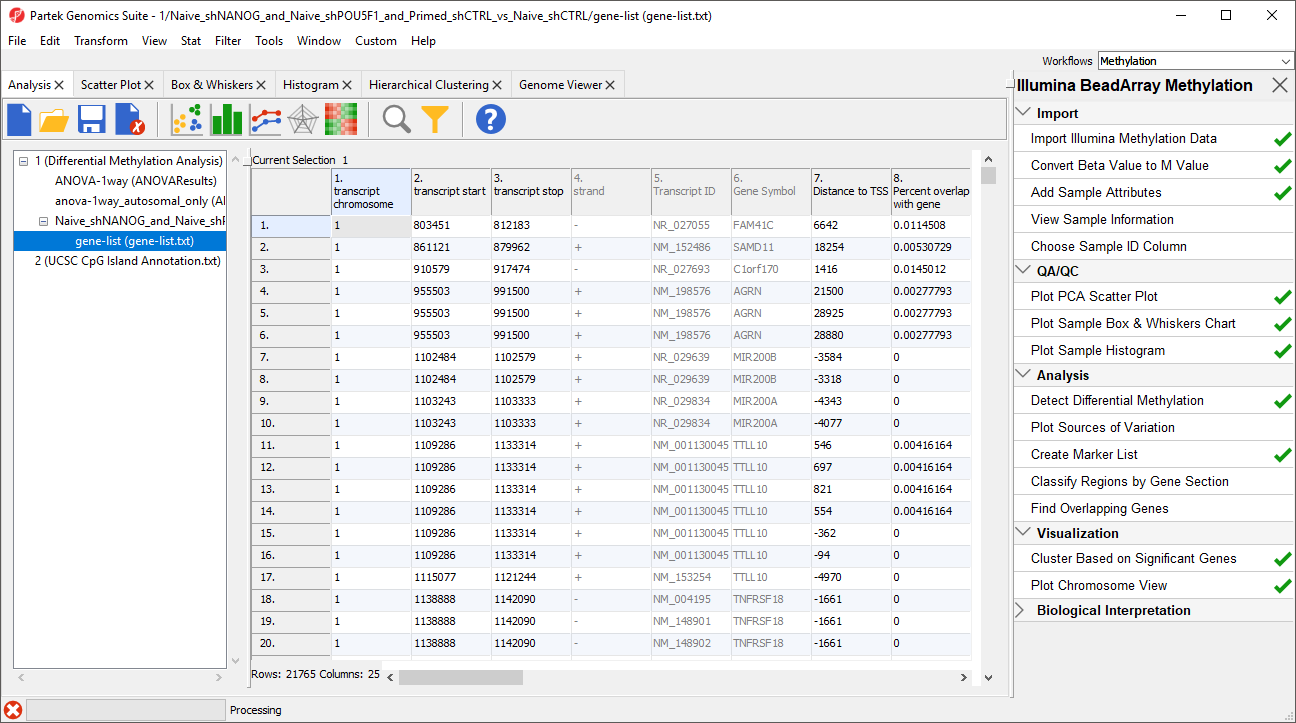 Figure 2. Annotating the differentially methylated CpG loci with genes
Partek Genomics Suite offers several tools to help interpret this list of genes. First, let's look at Gene Set Analysis.
Figure 2. Annotating the differentially methylated CpG loci with genes
Partek Genomics Suite offers several tools to help interpret this list of genes. First, let's look at Gene Set Analysis.
- Select Gene Set Analysis from the Biological Interpretation section of the Illumina BeadArray Methylation workflow
- Select GO Enrichment
- Select Next >
- Select 1/Native_shNANOG_and_Naive_shPOU5F1_and_Primed_shCTRL_vs_Naive_shCTRL/gene-list (gene-list.txt) for the source spreadsheet
- Select Next >
- Select Invoke gene ontology browser on the result and leave the rest of the options set to defaults
- Select Next >
- Select Default Mapping File
- Select Next >
A new spreadsheet will be created with categories ranked by enrichment score and the Gene Ontology Browser will launch to graphically display the results of the spreadsheet (Figure 3). The results show which gene sets are over represented in the list of genes overlapped by differentially regulated CpG loci between the experimental and control groups.
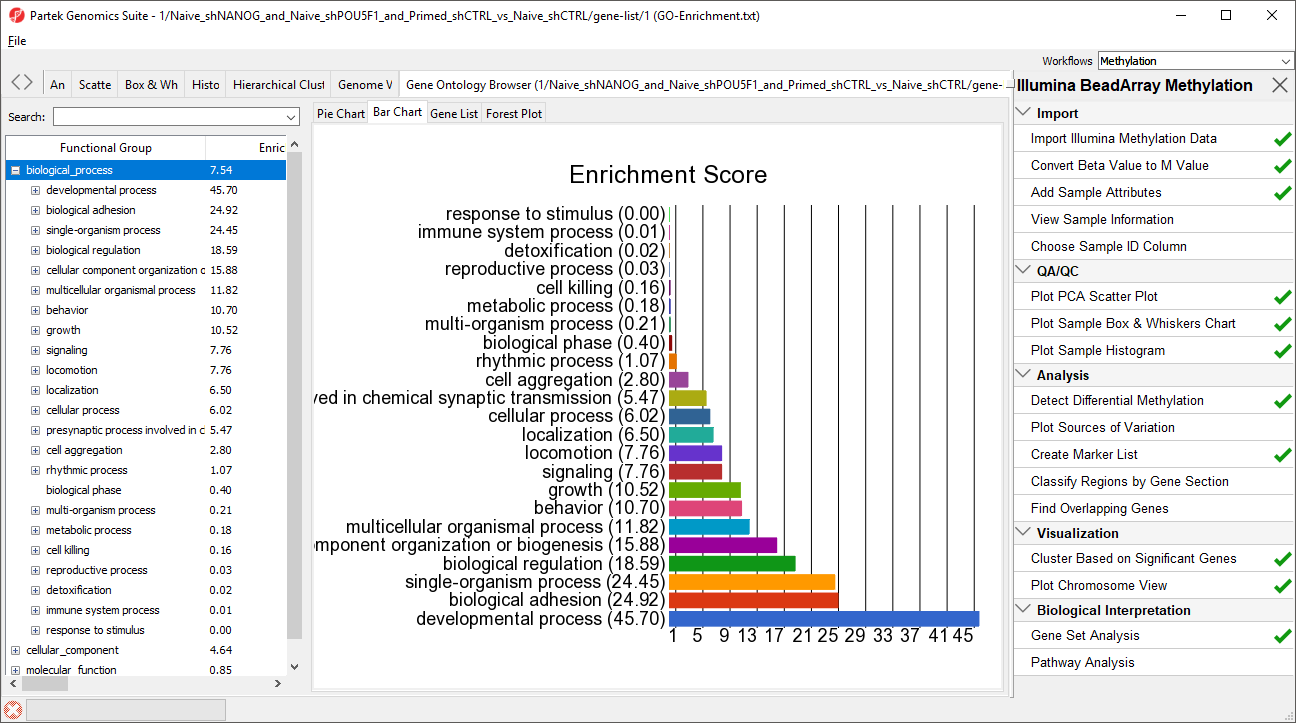 Figure 3. GO enrichment browser showing gene groups overrepresented in the list of genes which overlap with differentially methylated CpG loci
Next, we can perform Pathway Analysis to see which pathways are over represented in the gene overlapped by differentially regulated CpG loci.
- Select Pathway Analysis from the Biological Interpretation section of the Illumina BeadArray Methylation workflow
- Select Pathway Enrichment
- Select Next >
- Select 1/Native_shNANOG_and_Naive_shPOU5F1_and_Primed_shCTRL_vs_Naive_shCTRL/gene-list (gene-list.txt) for the source spreadsheet
- Select Next >
- Leave the default selections for the Configure parameters of the test panel
- Select Next >
- Leave the default selections for the Select the parameters panel
- Select Next > to run the analysis
The Pathway-enrichment spreadsheet will be added to the spreadsheet tree in Partek Genomics Suite and the Partek® Pathway™ software will open to provide visualization of the most significantly enriched pathway as a pathway diagram (Figure 4). The color of the gene boxes reflects p-values of the associated differentially methylated CpG loci (bright orange is insignificant, purple is highly significant).
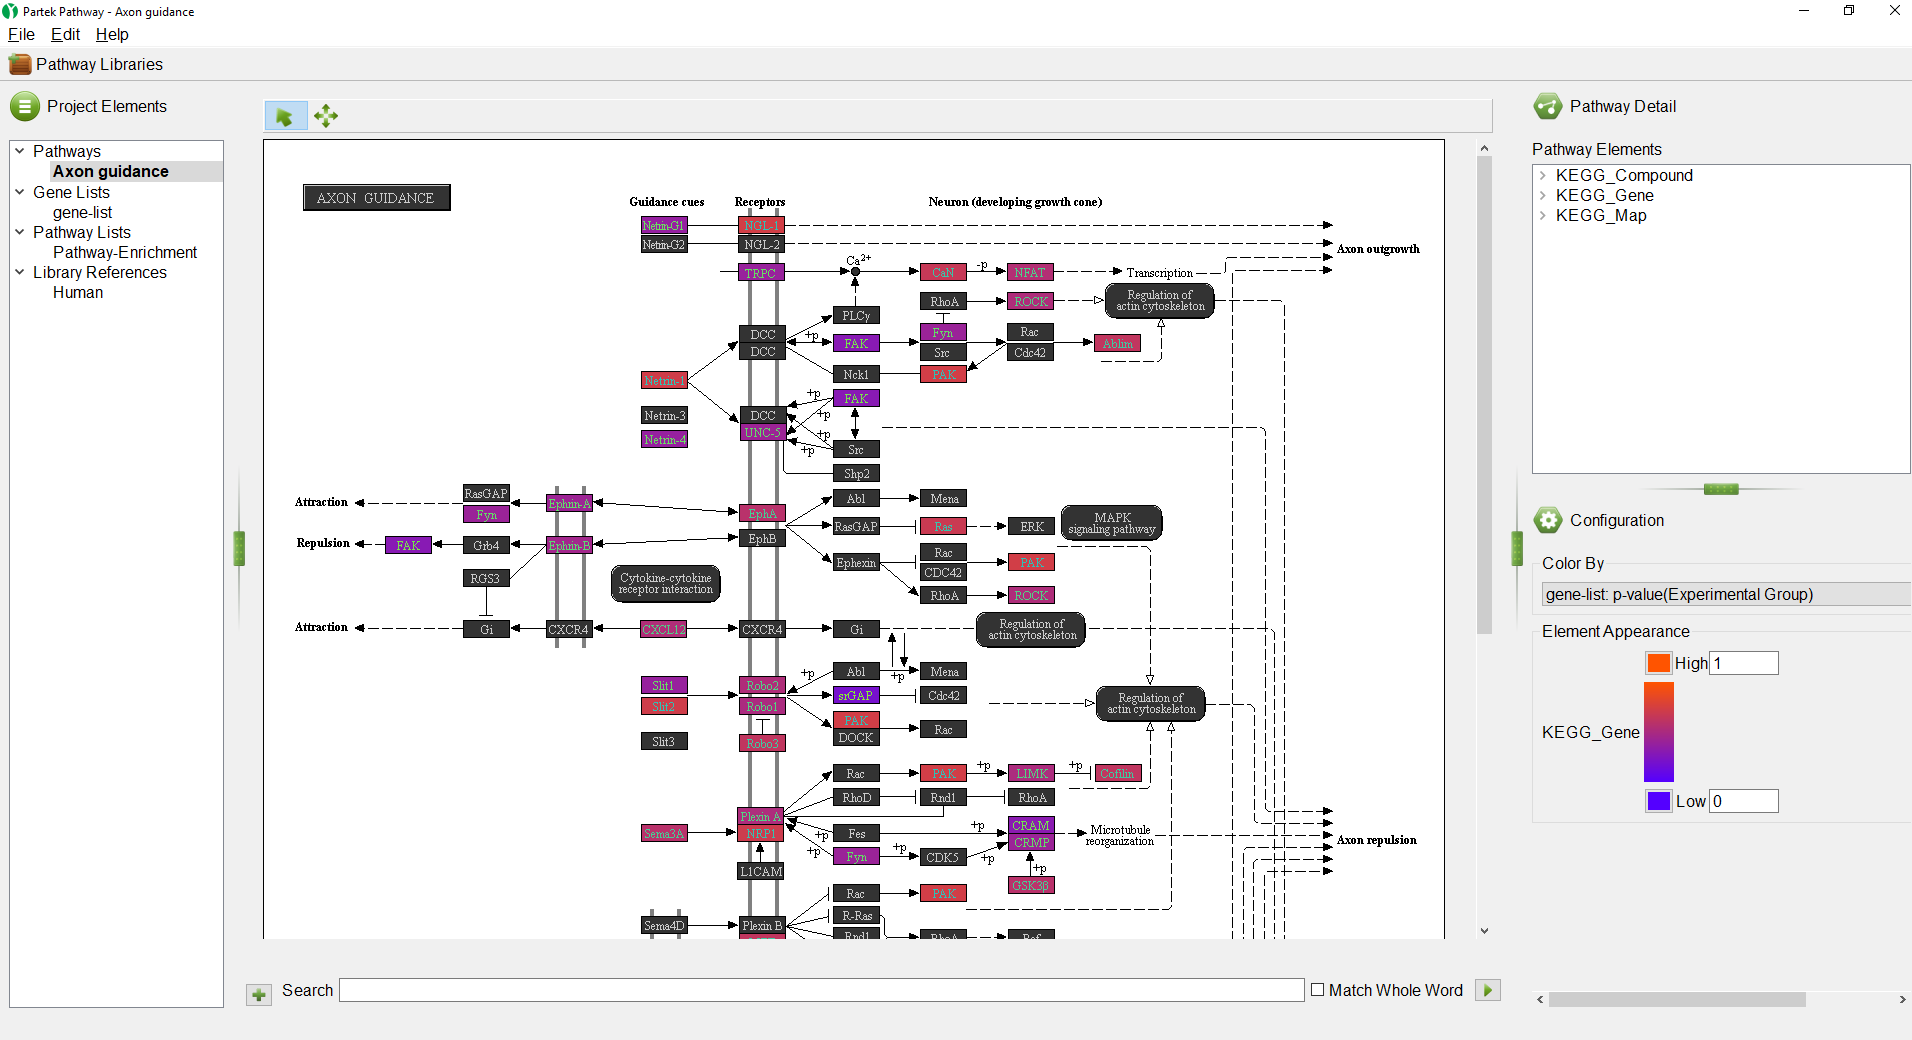 Figure 4. : Partek Pathway illustrating one of the pathways overrepresented in the list of genes overlapping the differentially methylated CpG sites.
Additional Assistance
If you need additional assistance, please visit our support page to submit a help ticket or find phone numbers for regional support.


| Your Rating: |
|
Results: |

|
0 | rates |
Overview
Content Tools