During a previous section of this tutorial, a spreadsheet named unexplained_regions was generated. This spreadsheet contains locations where reads map to the genome but are not annotated by the transcript database, in this case, RefSeqGene. Theunexplained_regions spreadsheet is potentially very interesting as it may contain novel findings.
- Right click column 6. Average Coverage and select Sort Descending from the menu
- Select Find Overlapping Genes from the Tools option in the command toolbar (Figure 1)
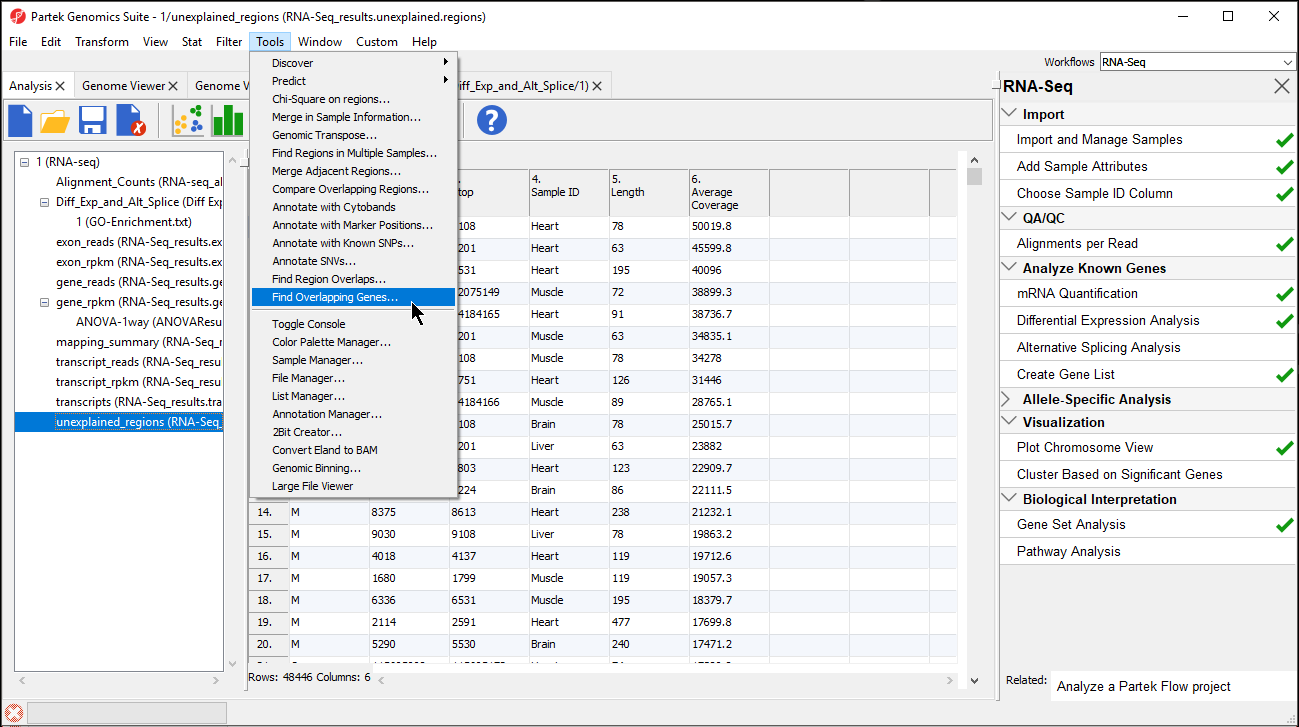
Figure 1. Selecting Find Overlapping Genes from Tools in the command toolbar
- Select Add a new column with the gene nearest to the region in the Find Overlapping Genes dialog (Figure 2)
- Select OK
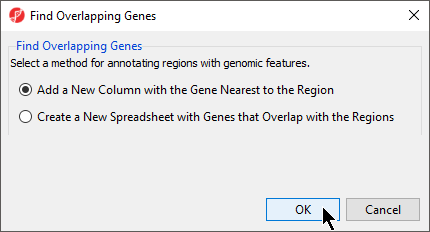
Figure 2. Find Overlapping Genes
- Select RefSeqTranscripts – 2014-01-03 from the Output Overlapping Features dialog (Figure 3)
Please note that it is recommended that you annotate with the same database as when you performed mRNA quantification.
- Select OK
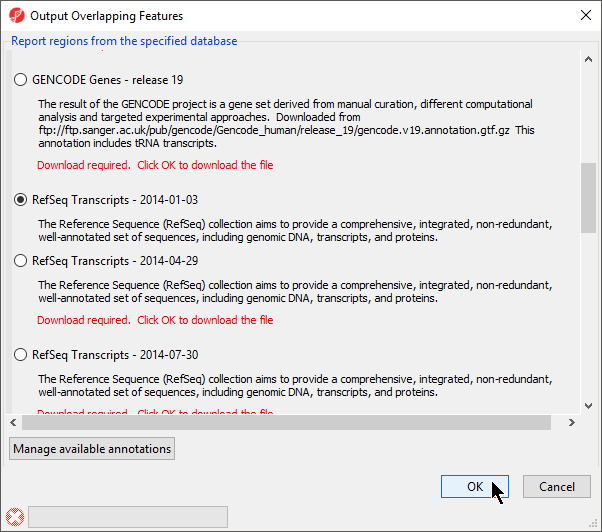
Figure 3. Select the database to search for overlapping features
Additional Assistance
If you need additional assistance, please visit our support page to submit a help ticket or find phone numbers for regional support.


| Your Rating: |
|
Results: |

|
0 | rates |
Overview
Content Tools