The significant CpG loci detected in the previous step actually form a methylation signature, which we shall now visualise by a heat map. Start by selecting the shPOU5F1_vsPrimed spreadsheet in the spreadsheet pane on the left and then invoking Cluster Based on Significant Genes from the workflow. In the next dialog select Hierarchical Clustering and then use the Standardise as the normalisation procedure. If you are working on β-values, you may want to try out None, as well, since the distribution of β-values is confined to the interval between 0 and 1.
The heat map will be displayed on the Hierarchical Clustering tab (Figure 1).
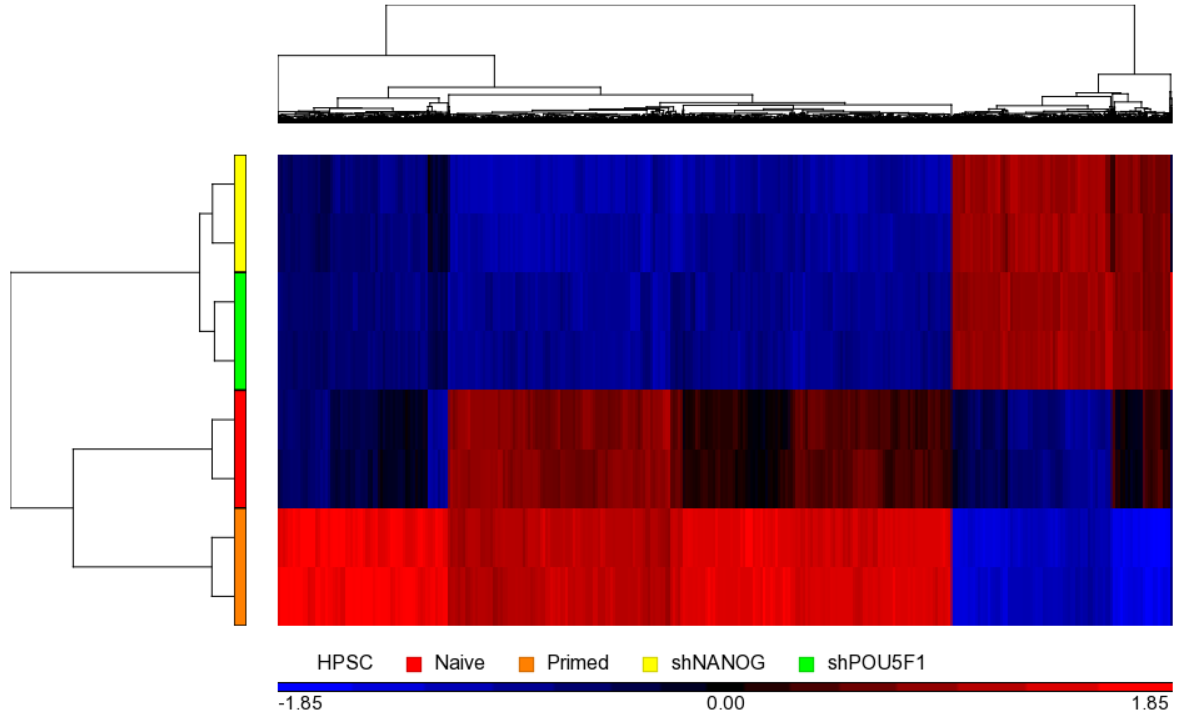 Figure 1. Hierarchical clustering with heat map invoked on a list of significant CpG loci
Additional Assistance
If you need additional assistance, please visit our support page to submit a help ticket or find phone numbers for regional support.


| Your Rating: |
|
Results: |

|
0 | rates |
Overview
Content Tools