The significant CpG loci detected in the previous step actually form a methylation signature that differentiates between LCLs and B cells. We can build and visualize this methylation signature using clustering and a heat map.
- Select the LCLs_vs_Bcells_CpG_Islands spreadsheet in the spreadsheet pane on the left
- Select Cluster Based on Significant Genes from the Visualization panel of the Illumina BeadArray Methylation workflow
- Select Hierarchical Clustering for Specify Method (Figure 1)
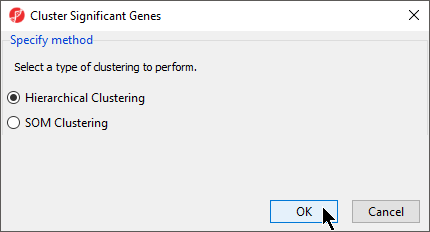
Figure 1. Selecting Heirarchical Clustering for clustering method
- Select OK
- Verify that LCLs_vs_Bcells_CpG_Islands is selected in the drop-down menu
- Verify that Standardize is selected for Expression normalization (Figure 2)
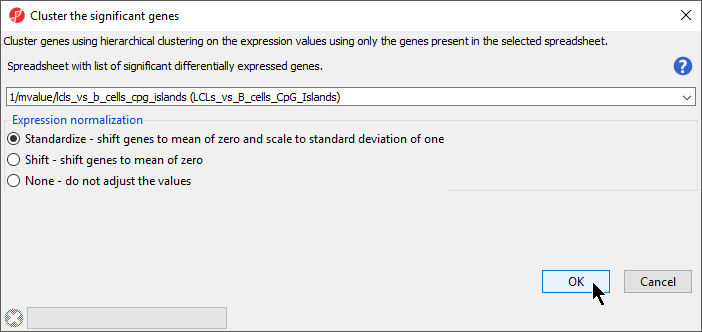
Figure 2. Selecting spreadsheet and normalization method for clustering
- Select OK
The heat map will be displayed on the Hierarchical Clustering tab (Figure 3).
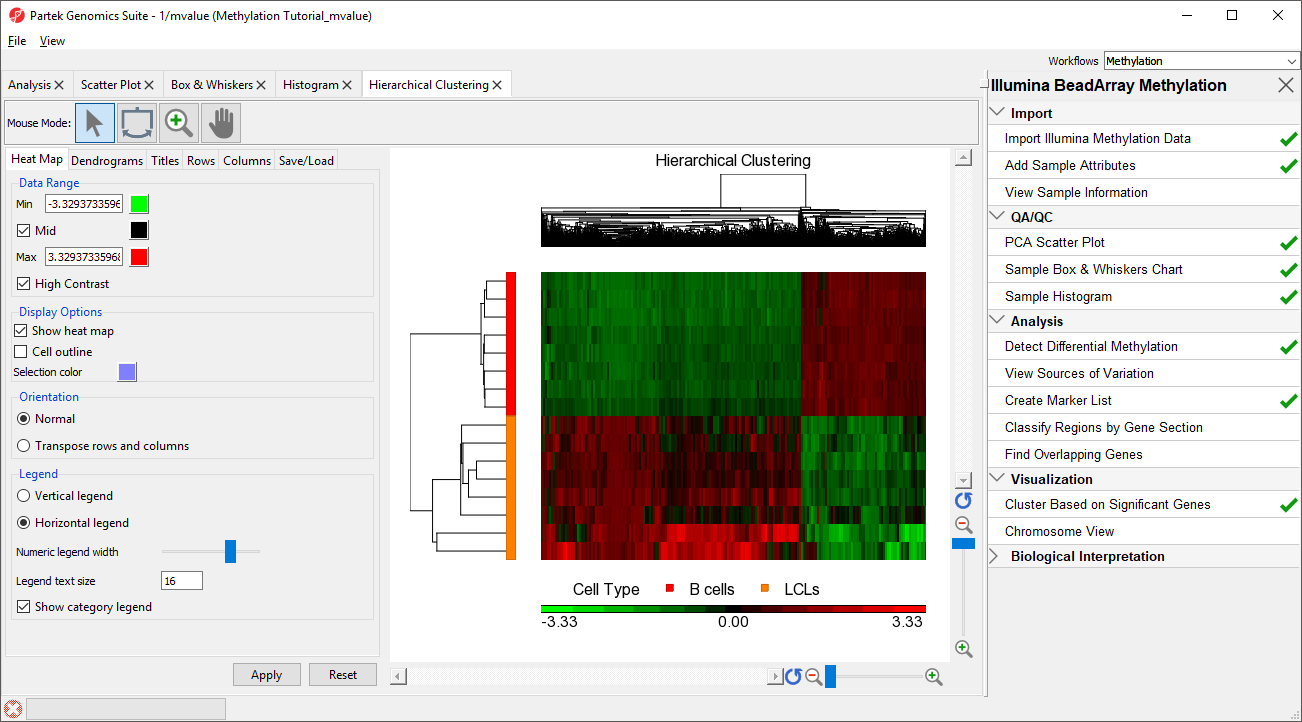 Figure 3. Hierarchical clustering with heat map invoked on a list of significant CpG loci
The experimental groups are rows, while the CpG loci from the LCLs vs B cells spreadsheet are columns. Methylation levels are compared between the LCLs and B cells groups. CpG loci with higher methylation are colored red, CpG loci with lower methylation are colored green. LCLs samples are colored orange and B cells samples are colored red in the dendrogram on the the left-hand side of the heat map.
Figure 3. Hierarchical clustering with heat map invoked on a list of significant CpG loci
The experimental groups are rows, while the CpG loci from the LCLs vs B cells spreadsheet are columns. Methylation levels are compared between the LCLs and B cells groups. CpG loci with higher methylation are colored red, CpG loci with lower methylation are colored green. LCLs samples are colored orange and B cells samples are colored red in the dendrogram on the the left-hand side of the heat map.
Additional Assistance
If you need additional assistance, please visit our support page to submit a help ticket or find phone numbers for regional support.


| Your Rating: |
|
Results: |

|
34 | rates |
Overview
Content Tools