Join us for a webinar: The complexities of spatial multiomics unraveled
May 2
Page History
Once a pipeline has been built in a project, it can be saved and re-used in other projects. The settings for each of the tasks will be saved, including the advanced settings. However, when running a saved pipeline, you may be prompted to specify additional settings (see Running a Pipeline). Furthermore, the task version is also saved. In very rare cases, a pipeline may include a version of a task that is no longer supported by Partek® Flow®. In this situation, the most recent version of the task will be applied to the data. For more information on task versions, see Task Version Management.
To save a pipeline:
Click the Make a pipeline link at the bottom of the screen under the Analyses tab (Figure 1)
Numbered figure captions SubtitleText Make a pipeline link shown underneath the task graph, under the Analyses tab of a project AnchorName Make pipeline link 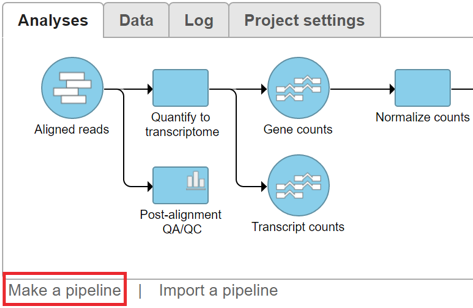
- In the dialog, name the pipeline and add an optional description (Figure 2). Make sure the Section name is set to Pipelines
Numbered figure captions SubtitleText Add a name and description of the new pipeline AnchorName Pipeline name and description 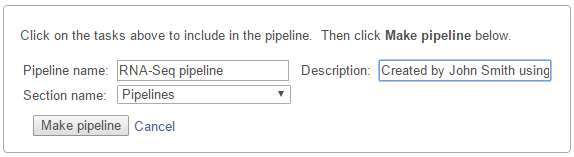
Left-click the rectangular task nodes you wish to save as part of the pipeline from the task graph. Selected tasks will have a thick black outline (Figure 3)
Numbered figure captions SubtitleText Choose the tasks from the task graph that you wish to include as part of the saved pipeline by left-clicking the rectangular task nodes. In this example, all four tasks will be saved AnchorName Pipeline task selection 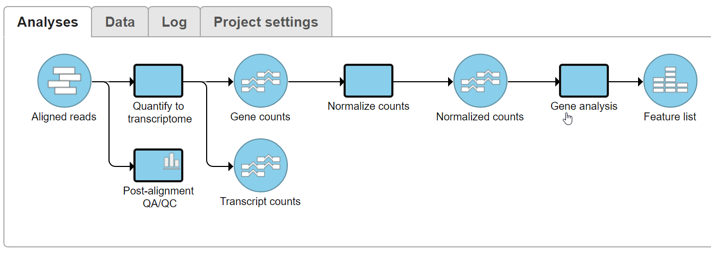
- Click the Make pipeline button (Figure 2). This saves the pipeline and the screen will return to the Analyses tab. To check if the pipeline has been saved, select the circular data node preceding the first task in the saved pipeline and it will appear in the context sensitive menu on the right under Pipelines (see Running a Pipeline).
...
To have a document showing all the steps in a pipeline, select one of the final data nodes (e.g. a Feature list node in Figure 3) and choose Data summary report. Details of each task in a pipeline will be shown on a single page, which can be saved as a PDF or HTML file. See Data Summary Reportsummary report for more details.
| Additional assistance |
|---|
|
| Page Turner | ||
|---|---|---|
|
| Rate Macro | ||
|---|---|---|
|
Overview
Content Tools