Page History
...
| Numbered figure captions | ||||
|---|---|---|---|---|
| ||||
|
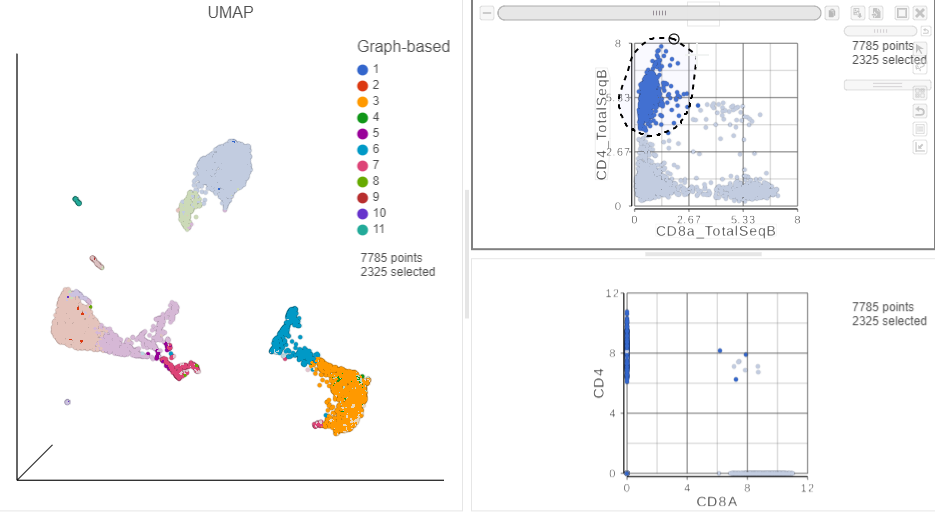
Let's perform the same test on the gene expression data.
- Click
in the top right of the plot to switch back to pointer mode
- Click on a blank spot on the plot to clear the selection
- On the second 2D scatter plot (with mRNA markers), click
- Manually select the cells with high expression of the CD4 gene marker (Figure ?)
...
This time, only 500 cells show positive expression for the CD4 marker gene. This means that the gene expression protein data is more less sparse (i.e. there are more zerosfewer zero counts), which further helps to reliably detect sub-populations.
...
Overview
Content Tools