Page History
...
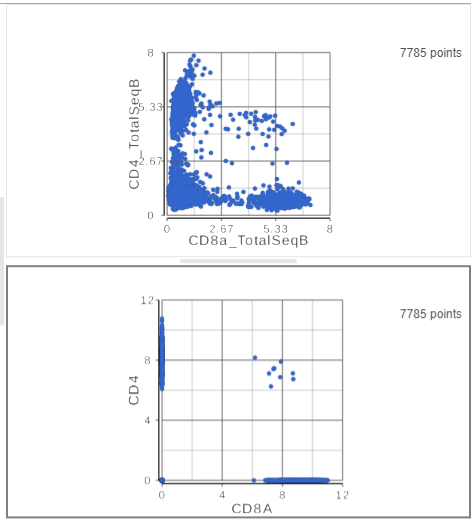
The second 2D scatter plot has the CD8A and CD4 mRNA markers on the x- and y-axis, respectively (Figure ?).
| Numbered figure captions | ||||
|---|---|---|---|---|
| ||||
|
- On the second 2D scatter plot, click
in the top right corner
- Manually select the cells with high expression of the CD4 gene marker (Figure ?)
| Numbered figure captions | ||||
|---|---|---|---|---|
| ||||
T cells
B cells
| Additional assistance |
|---|
...
Overview
Content Tools