Page History
...
Alignment matrices are often used in literature to model transcription factor binding sites, alignment matrices are matrices of nucleotide counts per position [1]. Each instance of the motif is aligned to each other and the number of nucleotides at eac hposition each position is counted and summarized in an alignment matrix. All positions from the set of genomic regions are scored against the alignment matrix. The scroe score represents how likely the position is an instance of the motif. A quality cutoff is used to determine which sequences in the regions are instances of the motif. The scoring scheme and quality cutoff are similar to [2] and it briefly described below:
Let M be a motif of length L consisting of N motif instances.Let A be a 4XL alignment matrix such that ai,j is the count of letter i at position j. Let Bi be the background frequency of letter i (calculated as the number of nucleotides i in the regions divided by the total oligonucleotides in the regions). Let S be a sequence of length L. The score of S given the alignment matrix is
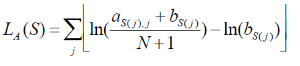
Let h be the maximum of LA. The quality score of a sequence is calculated as QA(S) =LA(S)/h. A quality score of 1 corresponds to a sequence with the most likely base at each position of the alignment matrix. User will specify a threshold QA. all sequences that have a score TA>QA *h will be reported.
Detect de novo motifs
Click on Peak data node, select Detect de novo motifs from Motif detection section in the pop-up menu (Figure 1), specify the number of motifs to detect and the length of the motifs.
...
Overview
Content Tools