Page History
...
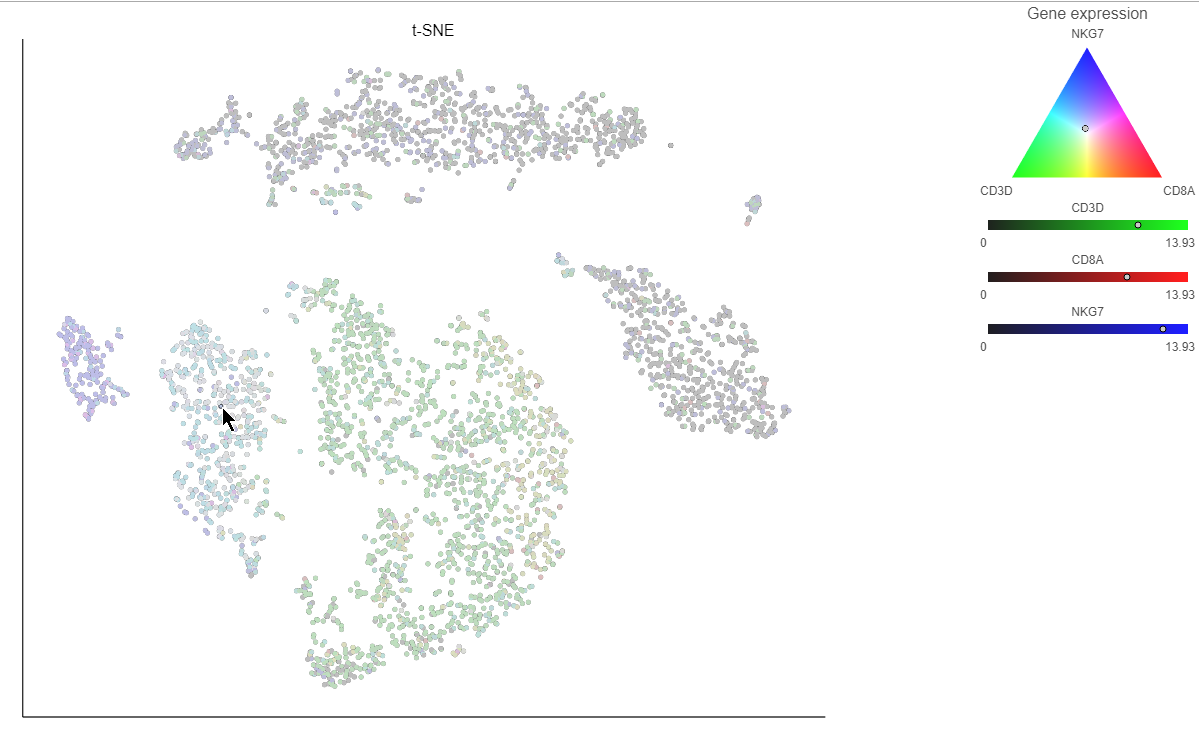
Clicking a cell on the plot shows the expression values of the cell in the legend (Figure 15).
| Numbered figure captions | ||||
|---|---|---|---|---|
| ||||
 |
...
| Numbered figure captions | ||||
|---|---|---|---|---|
| ||||
|
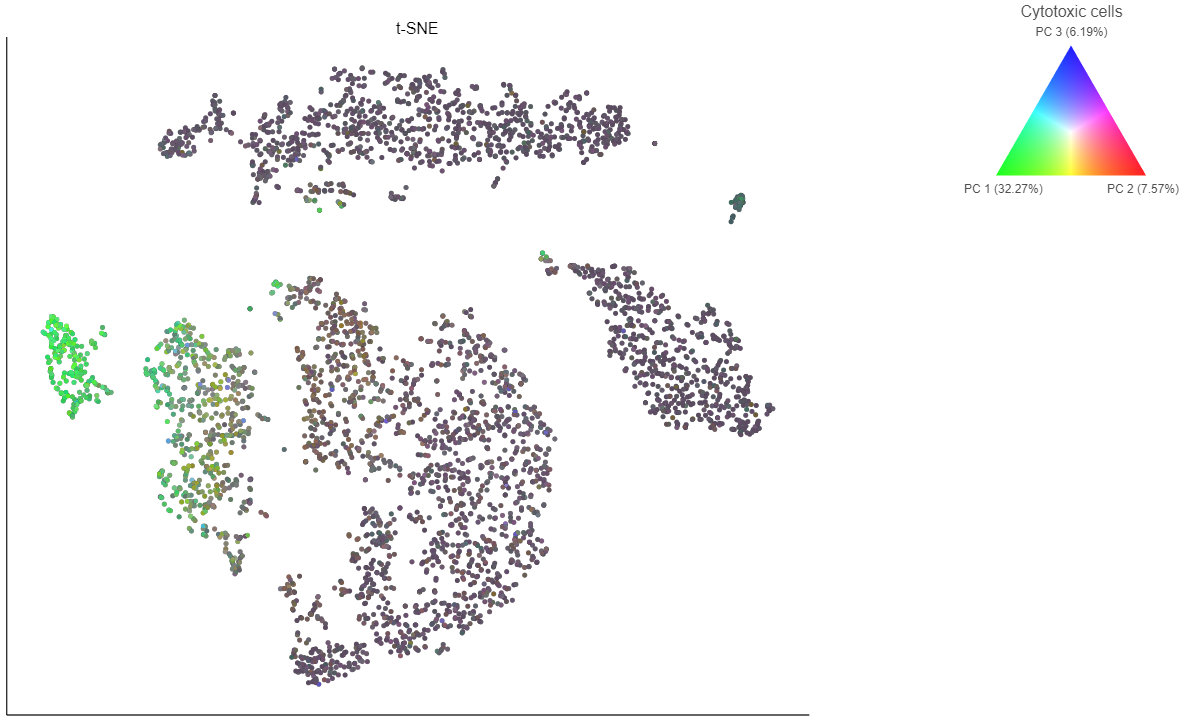
In addition to coloring by gene expression and by gene lists, the points can be colored by any cell or sample attribute. Each of the attributes is listed as an option in the Color by drop-down menu.
Selecting cells on the t-SNE scatter plot
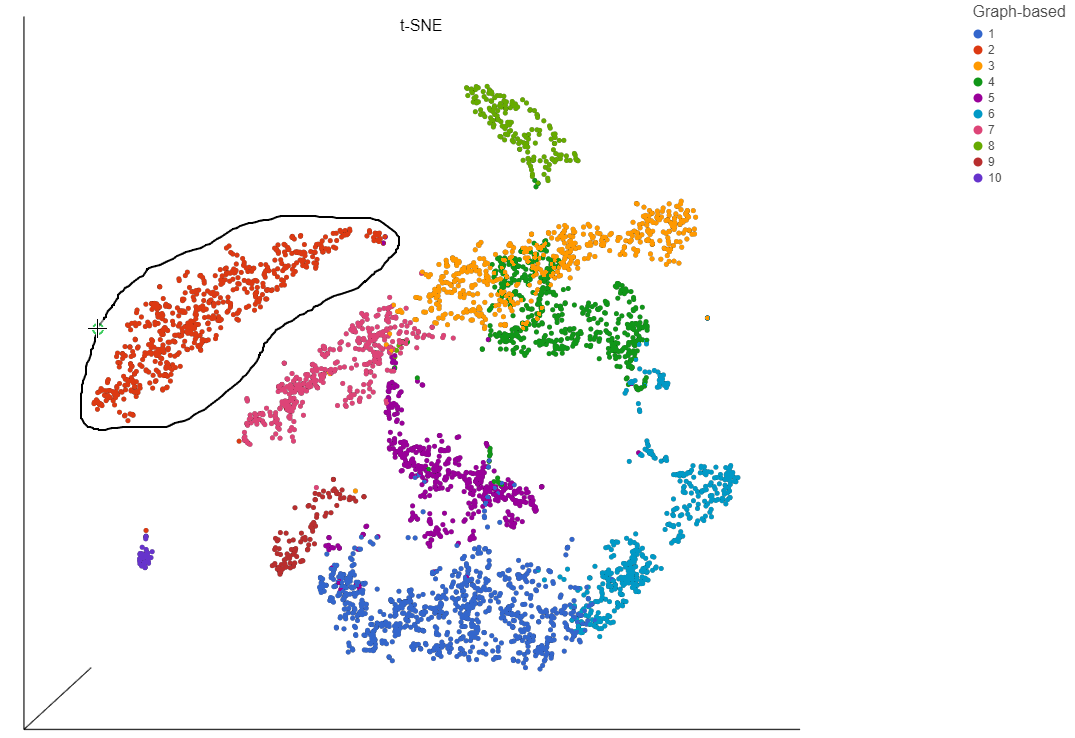
The most basic way to select a point on the scatter plot is to click it with the mouse while in pointer mode. To select multiple cells, you can hold Ctrl on your keyboard and click the cells. To select larger groups of cells, you can switch to Lasso mode by clicking ![]() at the top of the control panel. The lasso lets you freely draw a shape to select a cluster of cells.
at the top of the control panel. The lasso lets you freely draw a shape to select a cluster of cells.
- Click
 to activate Lasso mode
 - Left-click and hold to draw a lasso around a cluster of cells
- Release and click the starting circle to close the lasso and select the enclosed cells (Figure 17)
| Numbered figure captions | ||||
|---|---|---|---|---|
| ||||
|
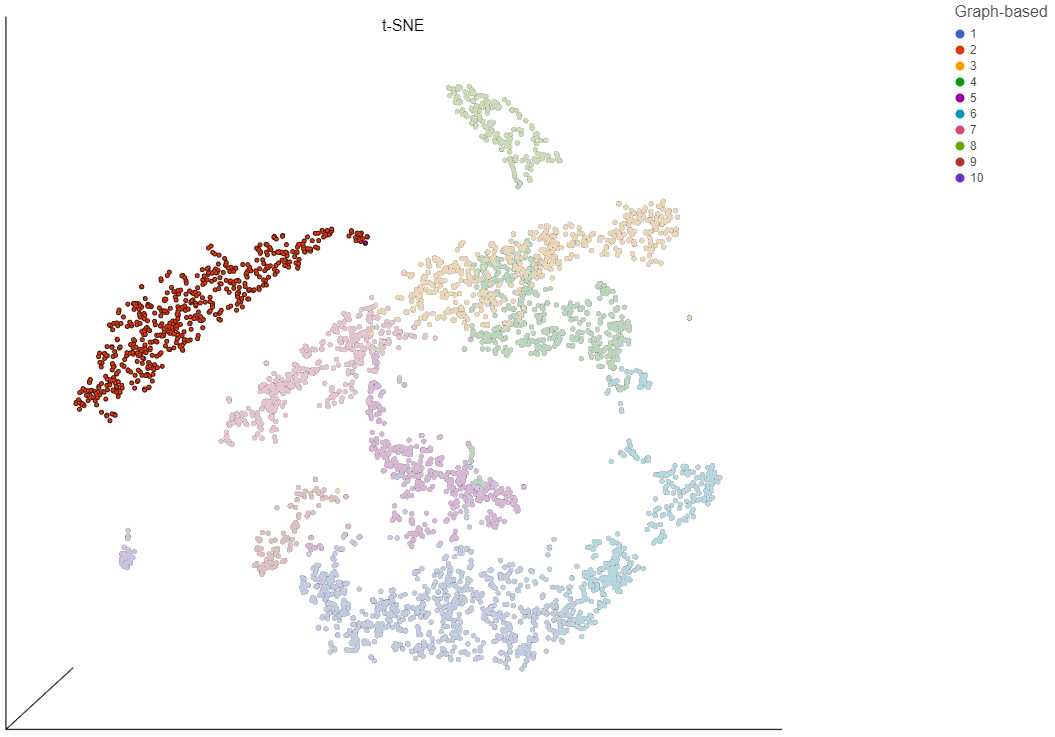
By default, selected cells are shown in bold while unselected cells are dimmed (Figure 18). This can be changed to gray unselected cells using the Selection/Filtering section of the control panel.
- Double-click any blank section of the scatter plot to clear the selection
| Numbered figure captions | ||||
|---|---|---|---|---|
| ||||
|
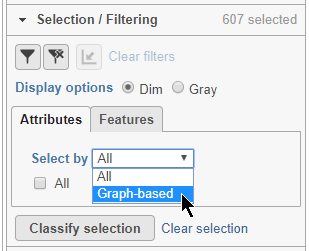
Alternatively, you can select cells using any categorical cell or sample attribute. In the Selection/Filtering panel, the Attributes tab drop-down menu lists all categorical attributes.
- Choose Graph-based from the Attributes drop-down menu in the Selection/Filtering section of the control panel (Figure 19)
| Numbered figure captions | ||||
|---|---|---|---|---|
| ||||
|
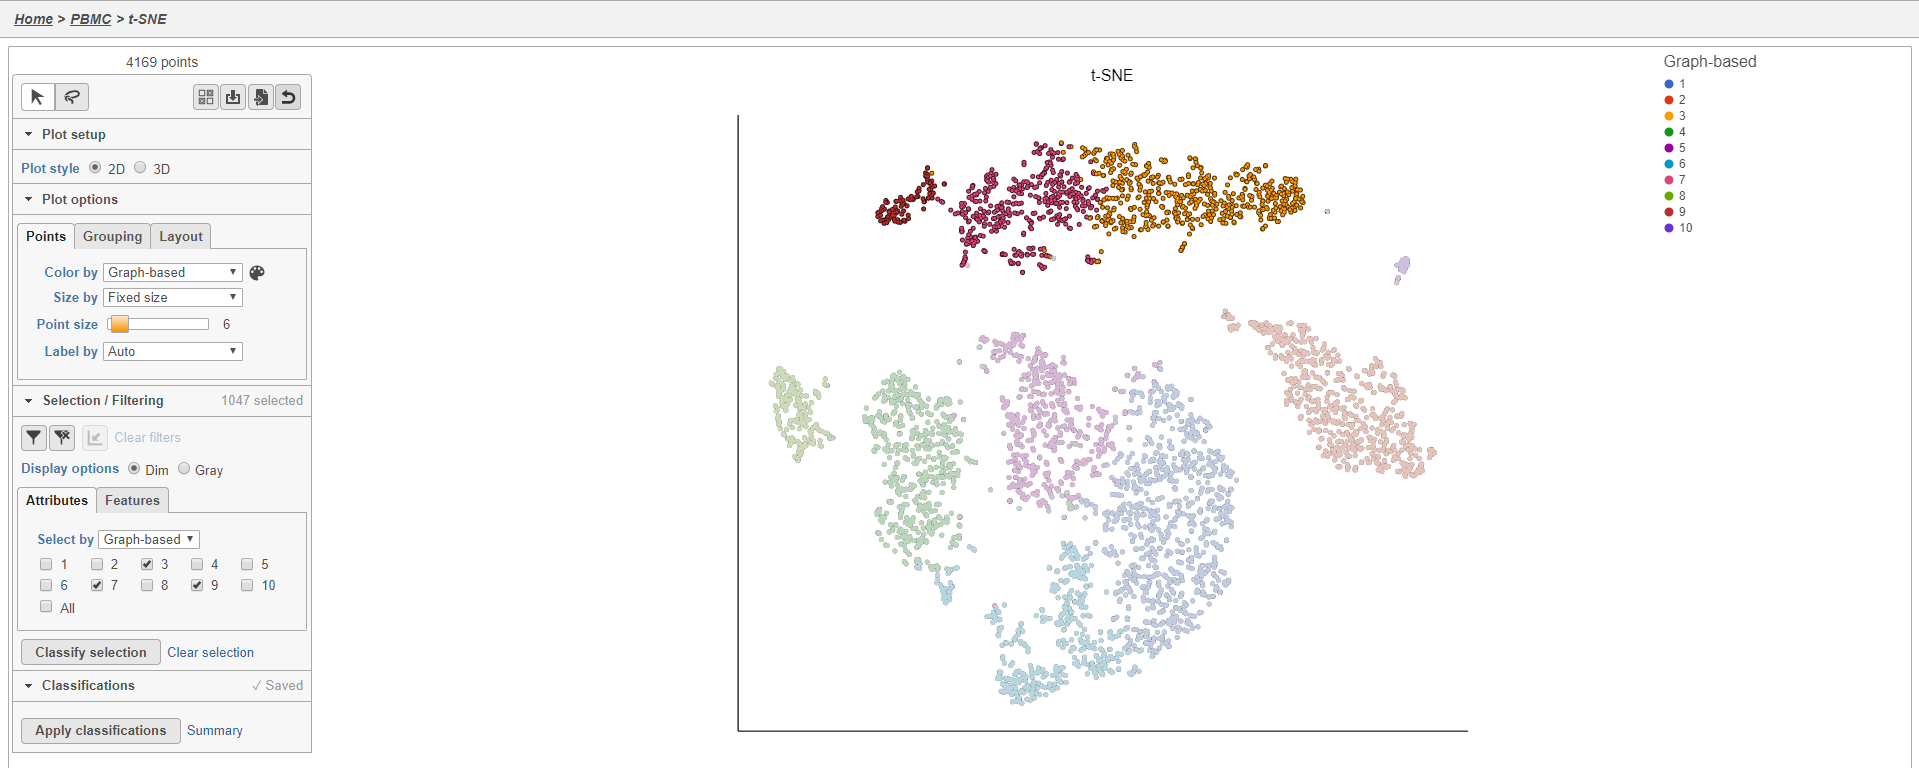
- Click 3, 7, and 9
This selects cells from Graph-based clusters 3, 7, and 9 (Figure 20). The number of selected cells is listed in the Selection/Filtering section of the control panel.
| Numbered figure captions | ||||
|---|---|---|---|---|
| ||||
|
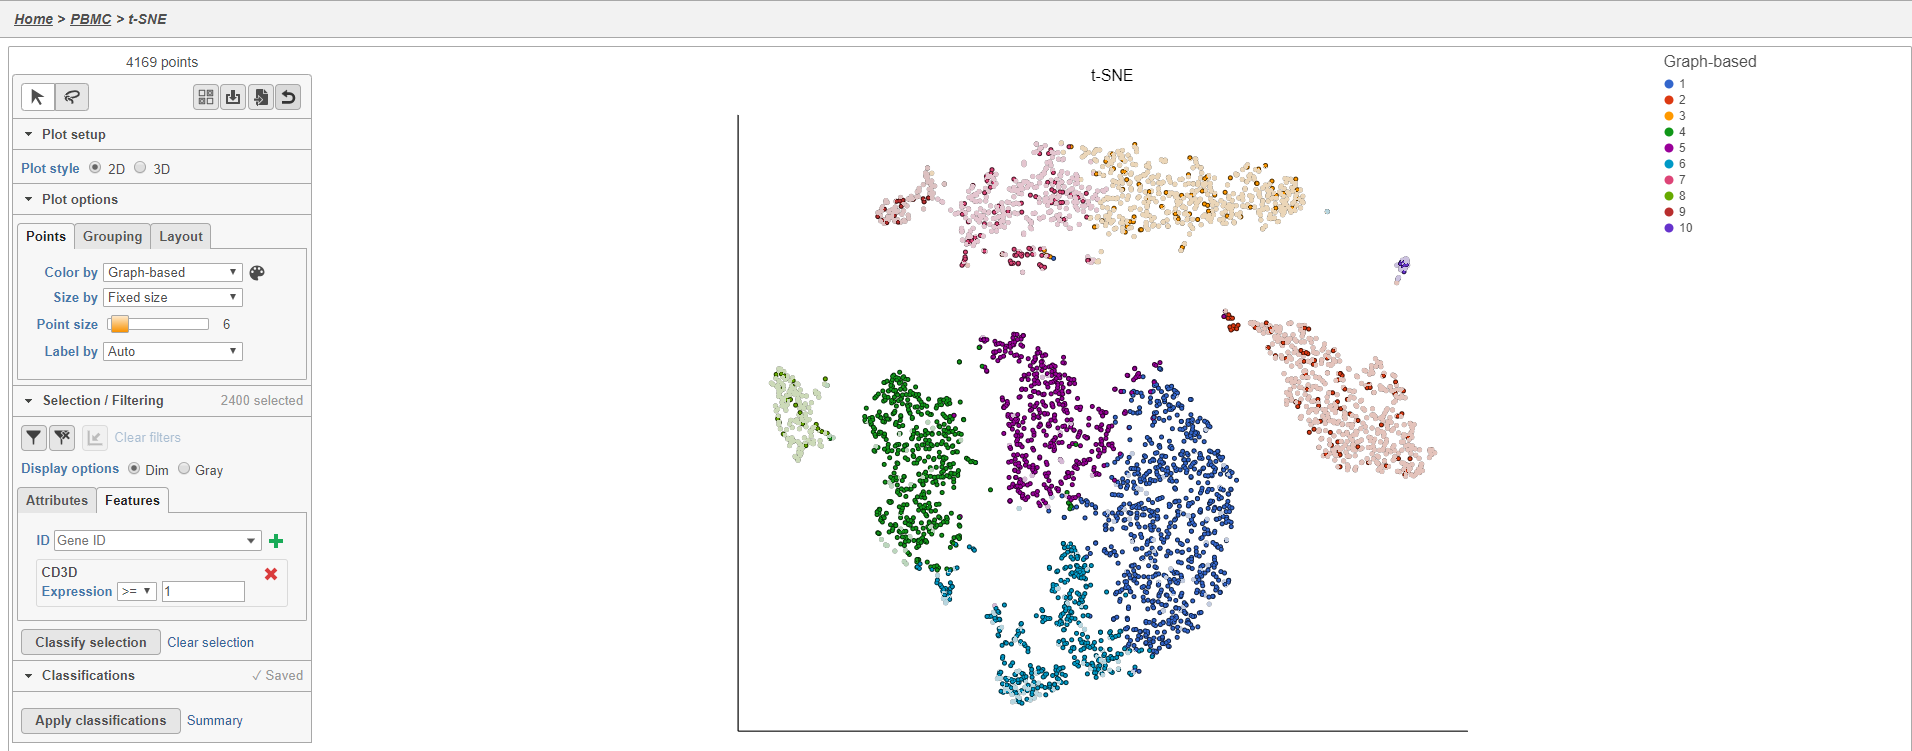
Cells can also be selected based on their gene expression values using the Features tab in the Selection/Filtering section.
- Click the Features tab
This gives a text-field where you can type any gene to use to filter the cells.
- Type CD3D in the text field
- Click
 to select by CD3D
By default, cells that expression >= 1 of the gene will be selected (Figure 21). The sign and value of the cutoff can be changed for each gene filter. You can add up to 5 gene filters by typing an additional gene names and clicking . Because these filters can be greater than or less than filters, it is possible to select a very specific population of cells using the feature filter. It may be useful to color by your genes of interest to help set the cutoff values.
| numbered-figure-captions | ||||
|---|---|---|---|---|
| ||||
|
Filtering cells on the t-SNE scatter plot
Once a cell has been selected on the plot, it can be filtered. The filter controls can exclude or include (only) any selected cell.
| additional-assistance |
|---|
|
| Rate Macro | ||
|---|---|---|
|
Overview
Content Tools