Page History
...
| Numbered figure captions | ||||
|---|---|---|---|---|
| ||||
|
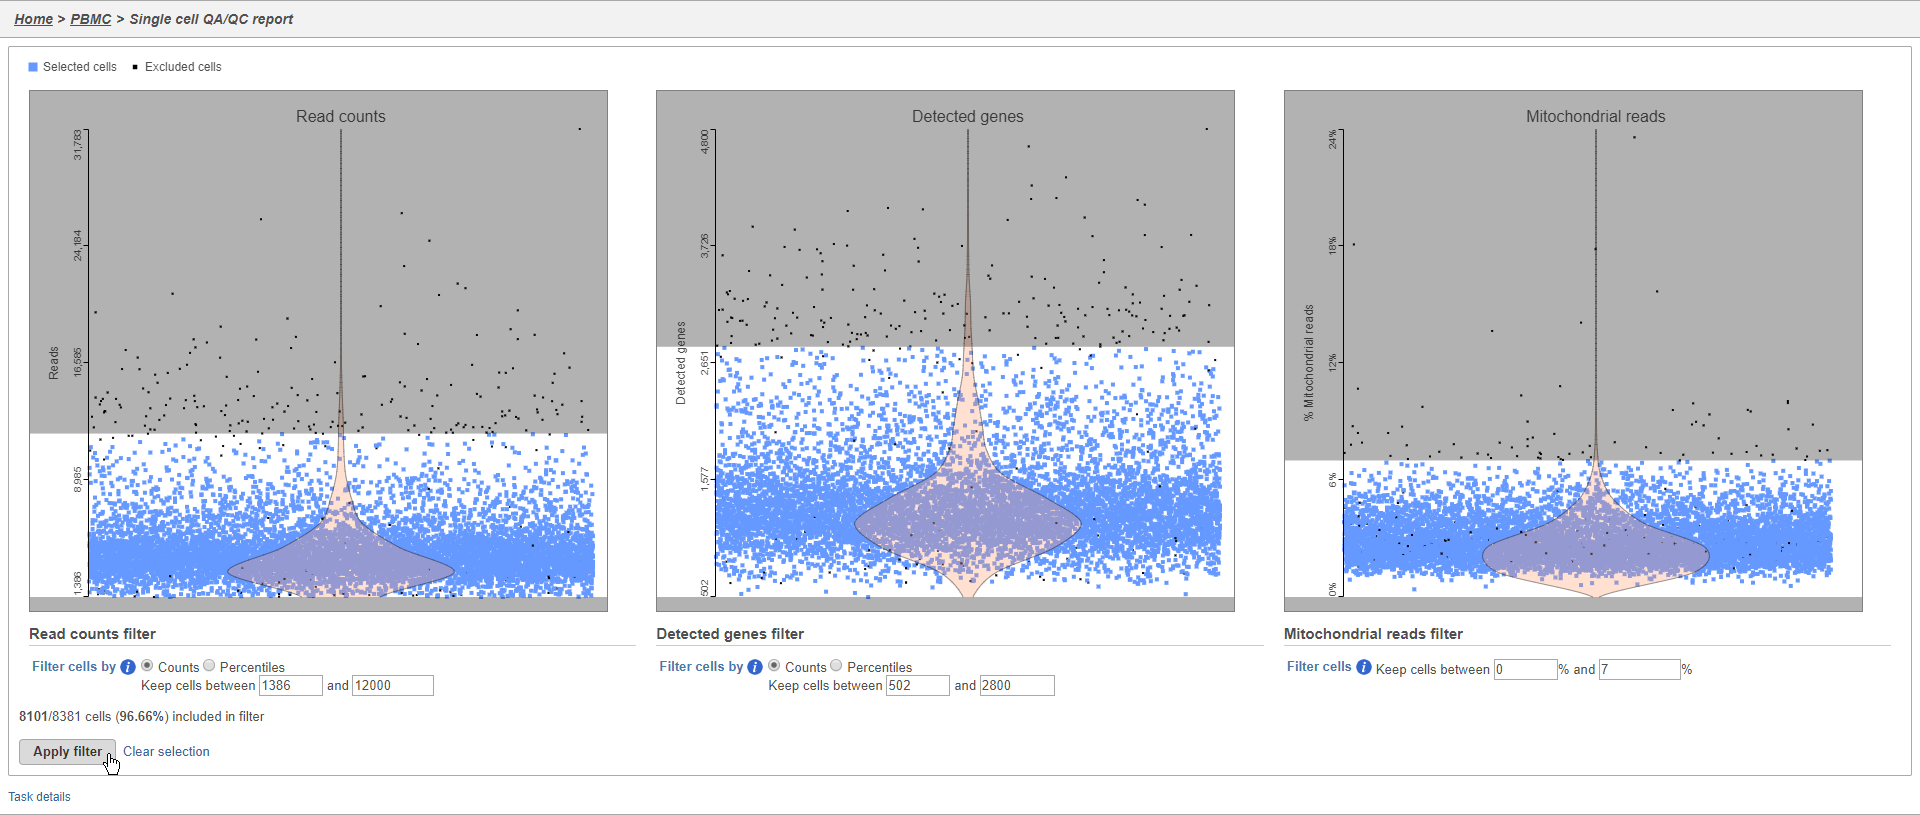
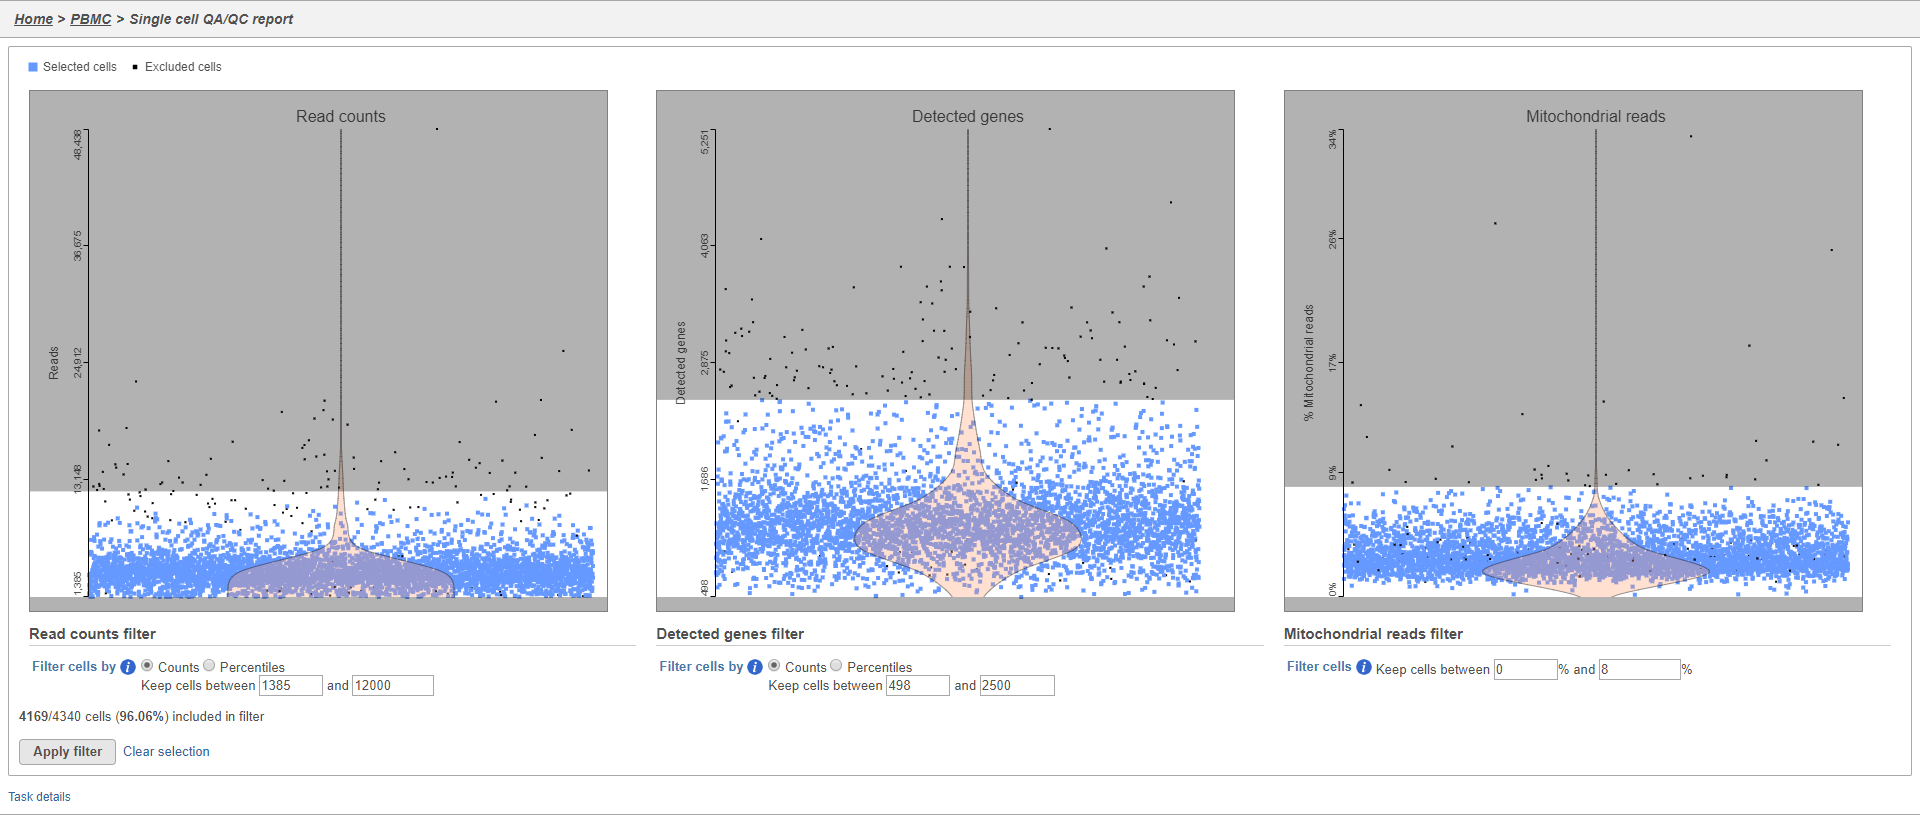
There are three plots: number of UMI counts per cell, number of detected genes per cell, and the percentage of mitochondrial counts per cell.
...
The UMI counts per cell and number of detected genes per cell are typically used to filter out potential doublets - if a cell as an unusually high number of total UMIs or detected genes, it may be a doublet. The mitochondrial counts percentage can be used to identify cells damaged during cell isolation - if a cell has a high percentage of mitochondrial counts, it is likely damaged or dying and may need to be excluded.
Normalization
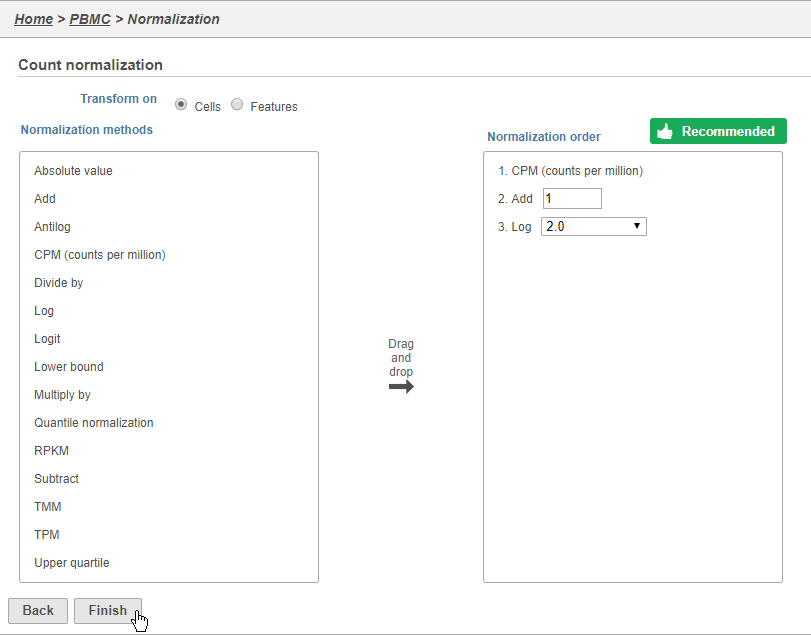
Because different cells will have a different number of total UMIs, it is important to normalize the data prior to downstream analysis. For droplet-based single cell isolation and library preparation methods that use a 3' counting strategy, where only the 3' end of each transcript is captured and sequenced, we recommend the following normalization - 1. CPM (counts per million), 2. Add 1, 3. Log2. This accounts for differences in total UMI counts per cell and log transforms the data, which makes the data easier to visualize.
- Click the Filtered counts node produced by the Filtered counts task
- Click Normalization and scaling in the task menu
- Click Normalization
- Click
 to add the recommended normalization scheme
This adds CPM (counts per million), Add 1, and Log2 to the Normalization order panel. Normalization steps are performed in descending order.
- Click Finish to apply the normalization (Figure 3)
| Numbered figure captions | ||||
|---|---|---|---|---|
| ||||
|
A new Normalized counts data node will be produced.
For more information on normalizing data in Partek Flow, please see the Normalize Counts section of the user manual.
Filtering genes
A common task in bulk and single-cell RNA-Seq analysis is to filter the data to include only informative genes. Because there is no gold standard for what makes a gene informative or not and ideal gene filtering criteria depend on your experimental design and research question, Partek Flow has a wide variety of flexible filtering options.
...
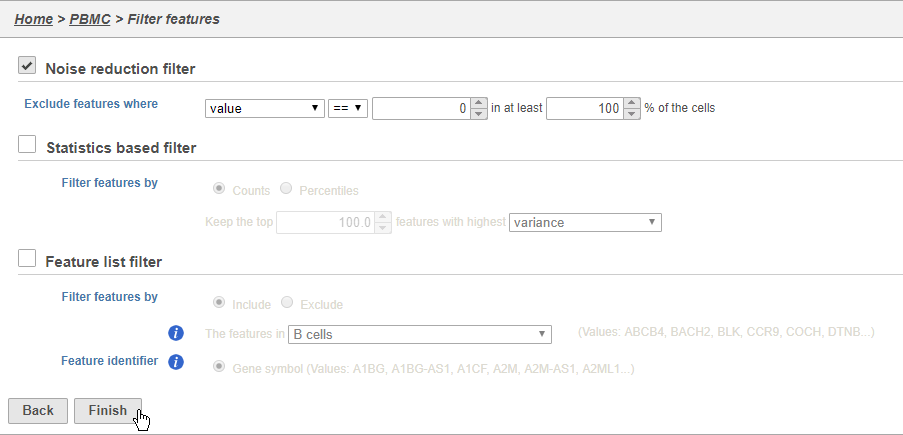
The noise reduction filter allows you to exclude genes considered background noise based on a variety of criteria. The statistics based filter is useful for focusing on a certain number or percentile of genes based on a variety of metrics, such as variance. The feature list filter allows you to filter your data set to include or exclude particular genes.
We will For example, you can use a noise reduction filter to exclude genes that are not expressed by any cell in the data set, but were included in the matrix file.
- Click the Noise reduction filter check box
- Set the Noise reduction filter to Exclude features where value == 0 in 100% of cells using the drop-down menus and text boxes
- Click Finish to apply the filter (Figure 34)
| Numbered figure captions | ||||
|---|---|---|---|---|
| ||||
|
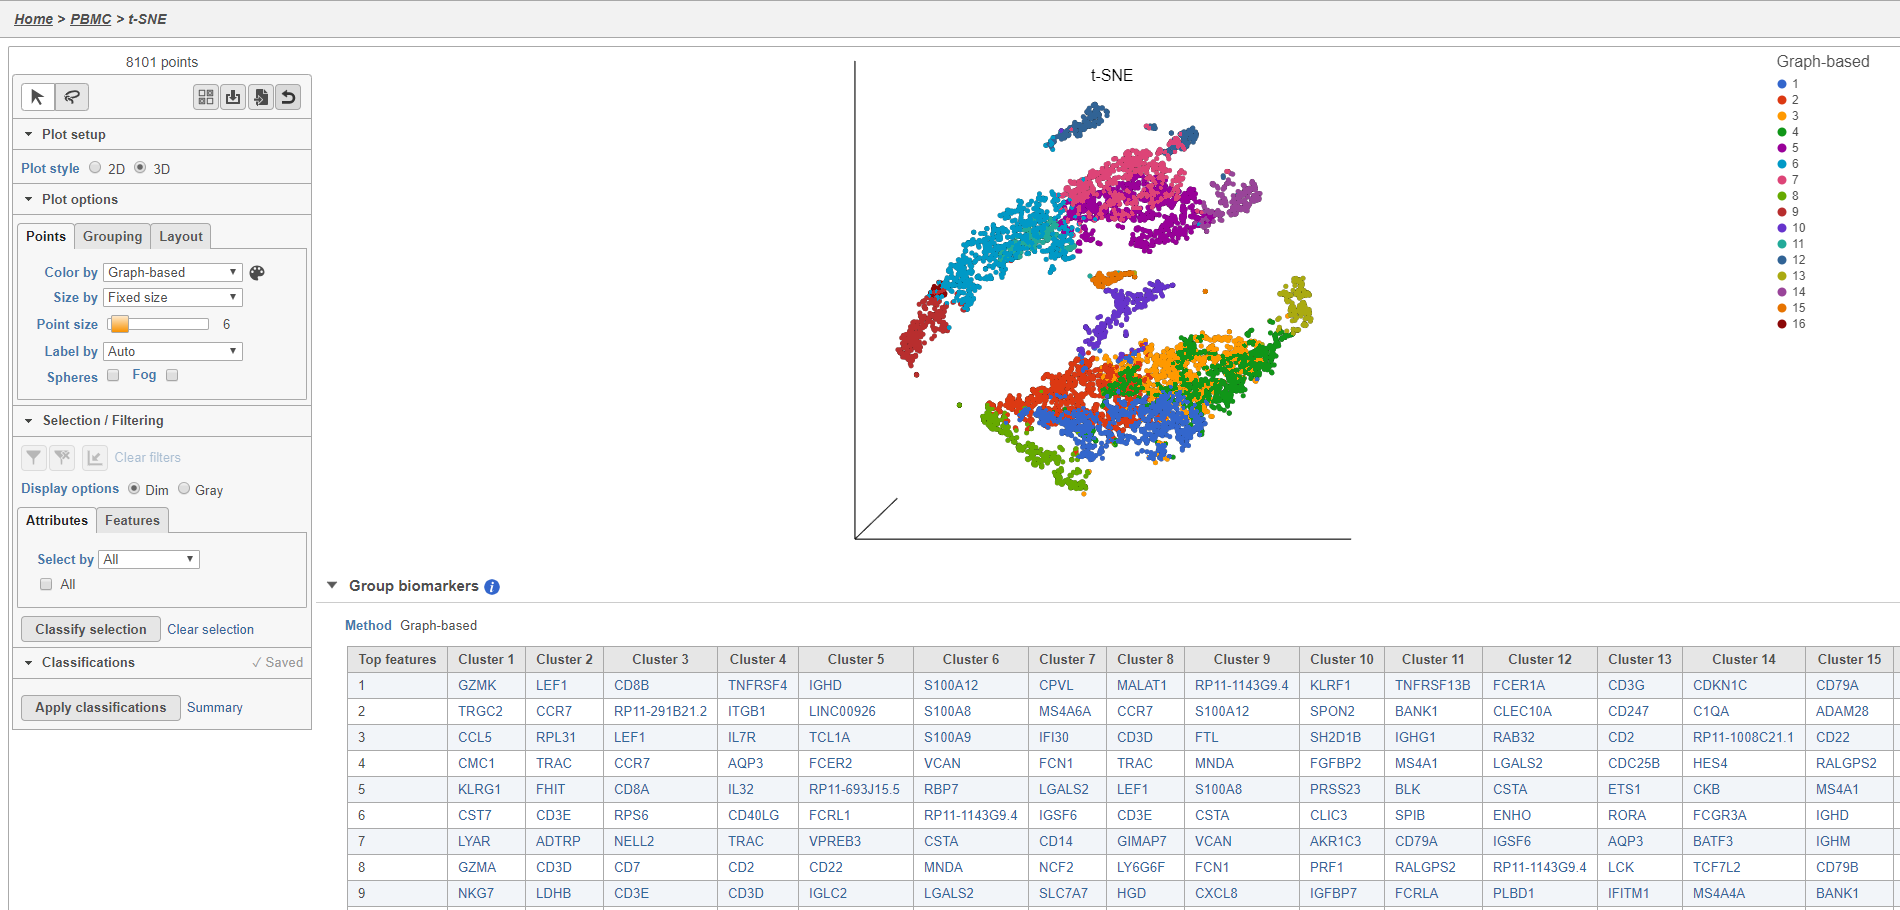
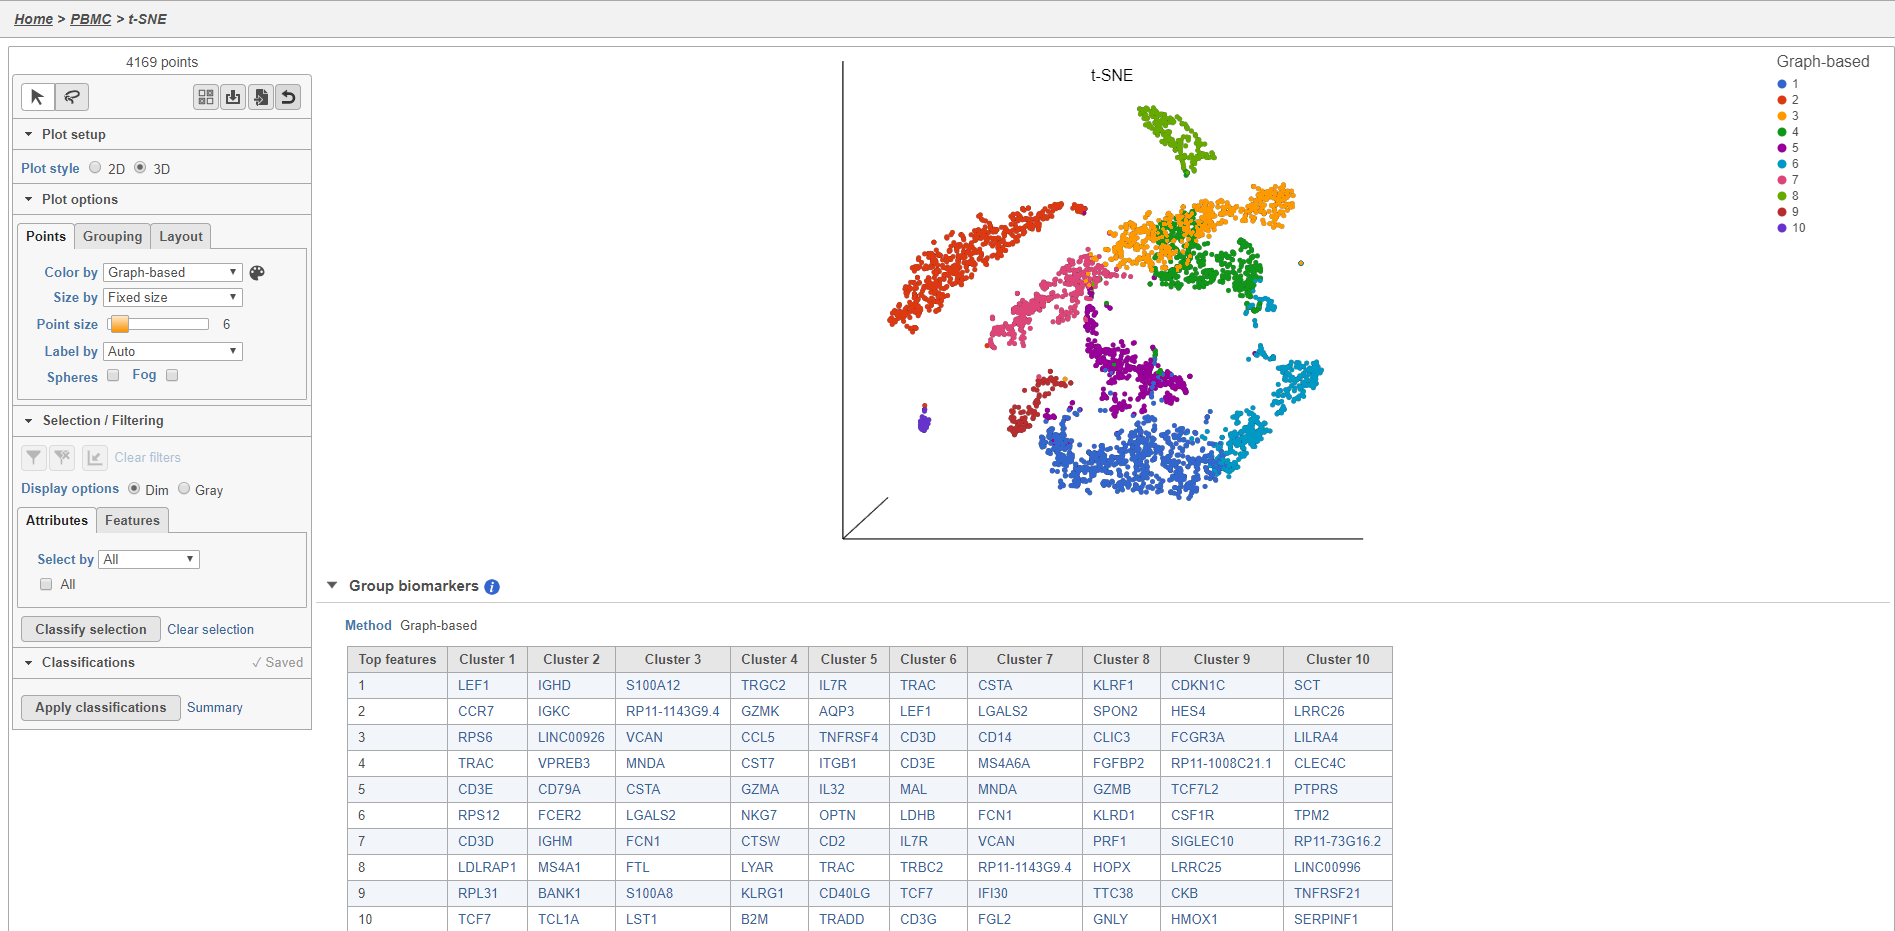
This produces a Filtered counts data node. This will be the starting point for the next stage of analysis - identifying cell types in the data using the interactive t-SNE plot.
Normalization
Because different cells will have a different number of total UMIs, it is important to normalize the data prior to downstream analysis. For droplet-based single cell isolation and library preparation methods that use a 3' counting strategy, where only the 3' end of each transcript is captured and sequenced, we recommend the following normalization - 1. CPM (counts per million), 2. Add 1, 3. Log2. This accounts for differences in total UMI counts per cell and log transforms the data, which makes the data easier to visualize.
- Click the Filtered counts node produced by the Filtered counts task
- Click Normalization and scaling in the task menu
- Click Normalization
- Click to add the recommended normalization scheme
This adds CPM (counts per million), Add 1, and Log2 to the Normalization order panel. Normalization steps are performed in descending order.
...
| Numbered figure captions | ||||
|---|---|---|---|---|
| ||||
|
A new Normalized counts data node will be produced.
For more information on normalizing data in Partek Flow, please see the Normalize Counts section of the user manual.
Scaling
For some data sets, it may be necessary to remove technical artifacts or batch effects. To do this, you can use the Scaling task in the Normalization and Scaling section. You will simply need to select whatever To configure the scaling task, select the cell or sample attribute effects you would like to regress out of the data set. The scaling task is detailed in our Single Cell Scaling white paper. We will not perform scaling for this data set.
...
| Numbered figure captions | ||||
|---|---|---|---|---|
| ||||
|
...
| Numbered figure captions | ||||
|---|---|---|---|---|
| ||||
|
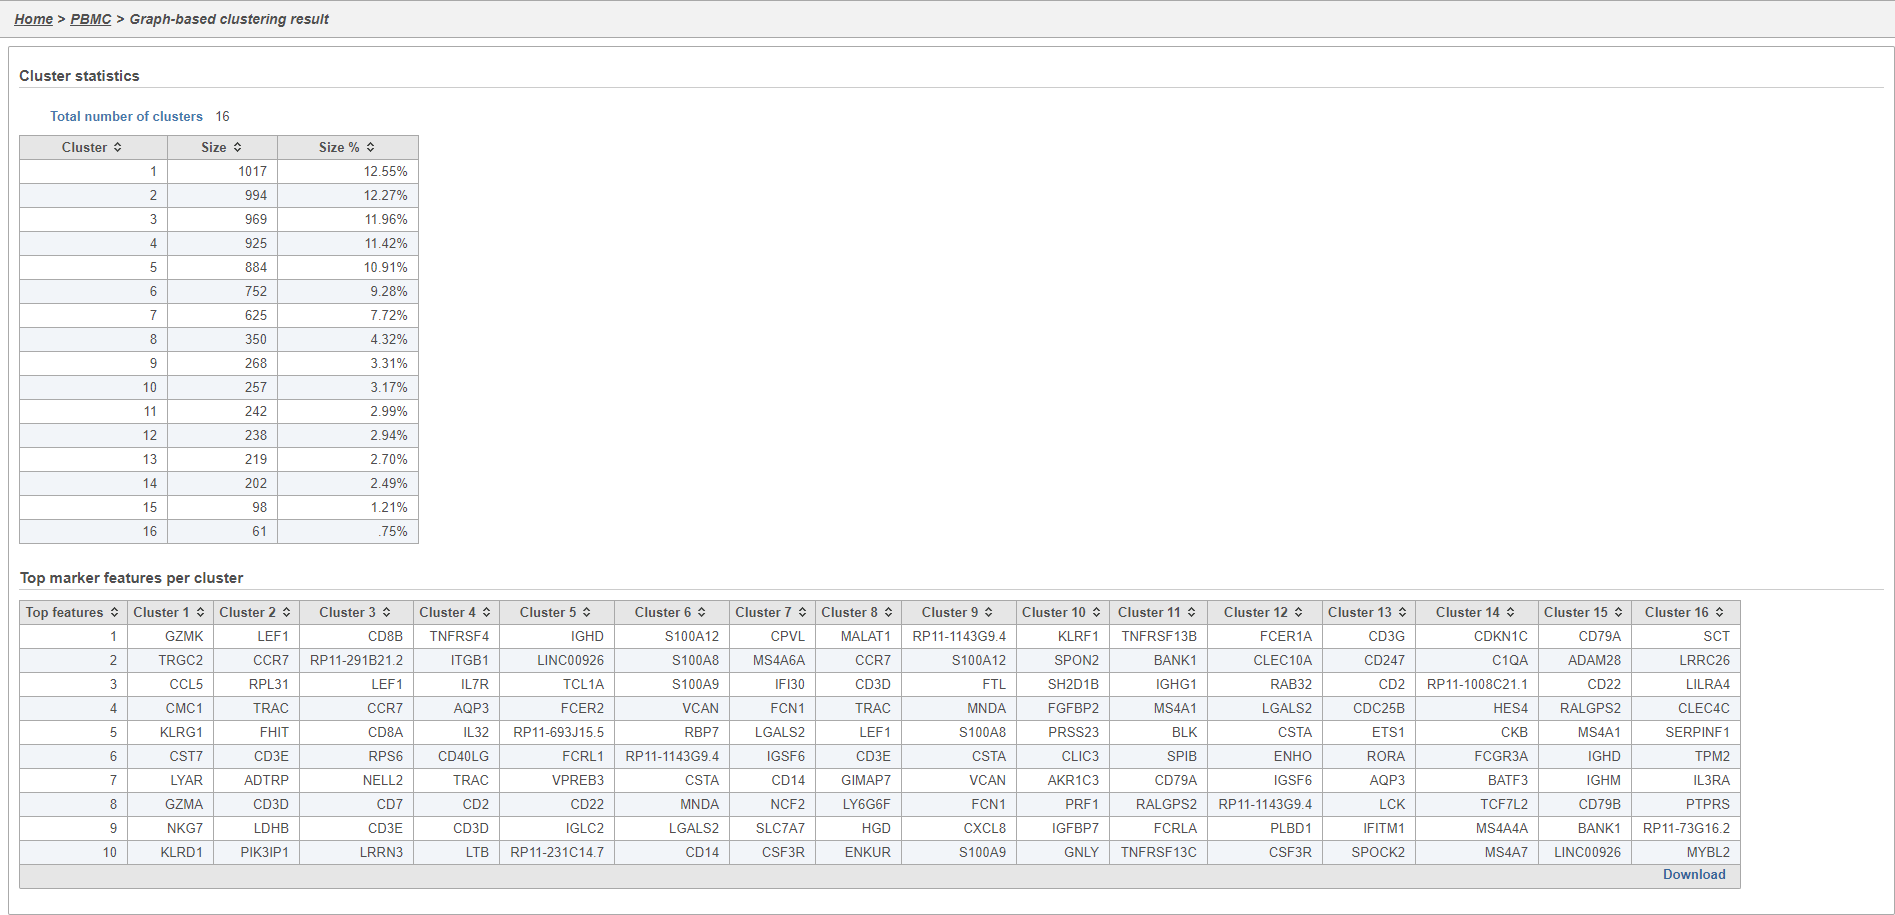
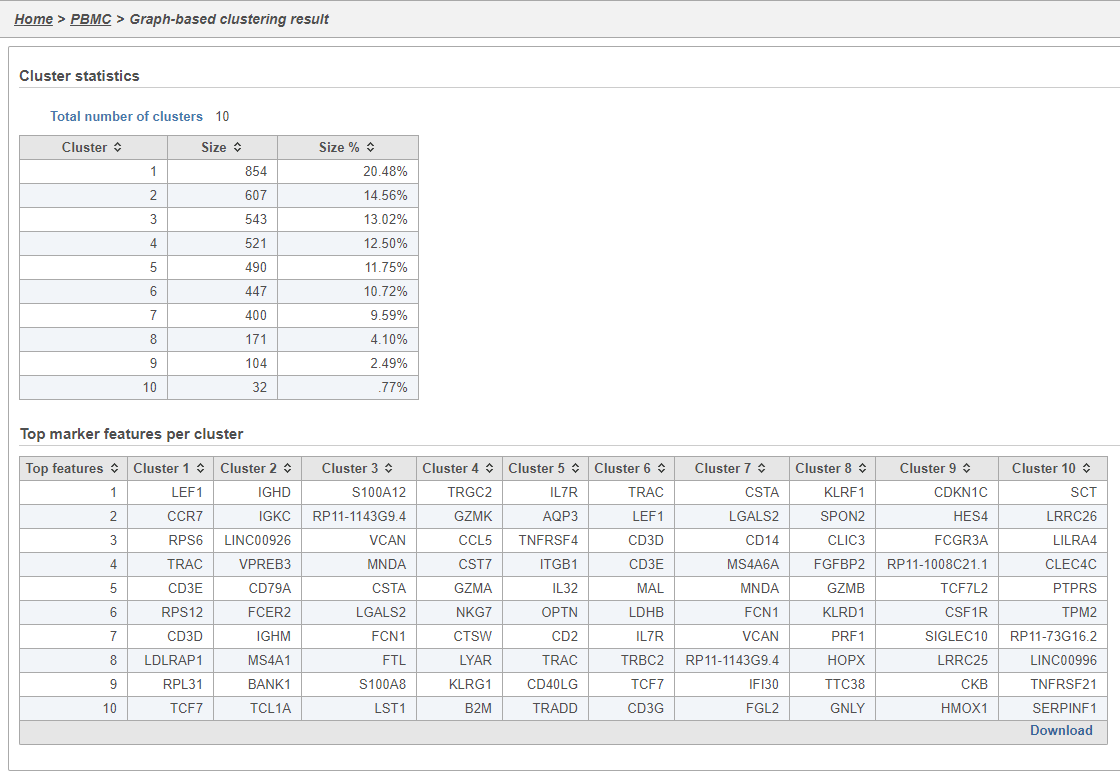
Graph-based clustering
...
| Numbered figure captions | ||||
|---|---|---|---|---|
| ||||
|
...
| Numbered figure captions | ||||
|---|---|---|---|---|
| ||||
|
...
Overview
Content Tools