Page History
...
Principal Components Analysis (PCA) is an excellent method to visualize similarities and differences between the samples in a data set. PCA can be invoked through a workflow, by selecting () selecting ![]() from the main command bar, or by selecting Scatter Plot from the View section of the main toolbar. We will use a workflow.
from the main command bar, or by selecting Scatter Plot from the View section of the main toolbar. We will use a workflow.
...
Next, we will identify miRNAs that are differentially expressed between brain and heart tissues.
- Selectthe Select the Analysis tab
- Select the Affy_miR_BrainHeart_intensities spreadsheet
- Selelct Select Detect Differentially Expressed miRNAs from the Analysis section of the workflow
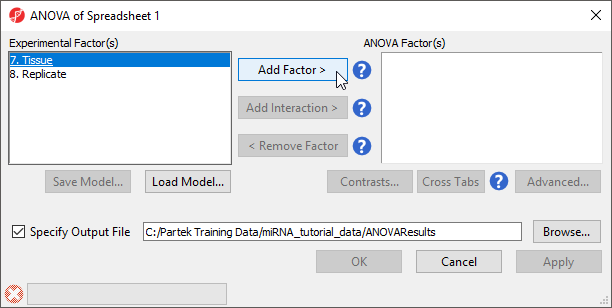
The ANOVA dialog (Figure 4) allows us to configure the comparisons we want to make between samples and groups within the data set.
| Numbered figure captions | ||||
|---|---|---|---|---|
| ||||
|
...
The Configure ANOVA dialog (Figure 5) is used to set up contrasts. Contrasts are the comparisons between groups and are where experimental questions can be asked. In this study, we are asking what miRNAs are differentially expressed between heart and brain tissue.
| Numbered figure captions | ||||
|---|---|---|---|---|
| ||||
|
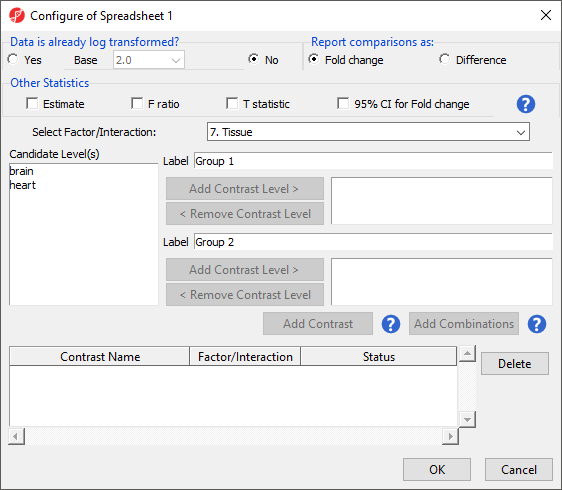
- Select Yes forfor Data is already log transformed?
- Select Fold change for Report comparisons as
- Select 7. Tissue from the Select Factor/Interaction drop-down menu
- Select brain from the left panel
- Select Add Contrast Level > to move brain to the upper group - initially Group 1
- Select heart from the left panel
- Select Add Contrast Level > to move heart to the lower group - initially Group 2
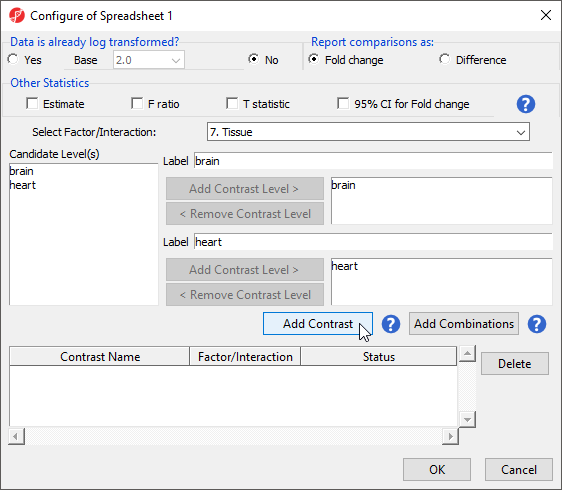
This contrast (Figure 6) will compare expression of miRNAs in brain samples to expression in heart samples with brain as the numerator and heart as the denominator for fold-change calculations.
| Numbered figure captions | ||||
|---|---|---|---|---|
| ||||
|
...
You may explore what is known about any listed microRNA miRNA using external databases TargetScan, miRBase, microRNA.org, or miR2Disease, by right-clicking a row header, selecting Find miRNA in... and choosing one of the external databases. This will open a web page in your default web browser and requires your computer be connected to the internet.
...
The top 33 miRNAs we see (Figure 10) are all miR-124 from different species. The miRNA miR-124 is the most abundant miRNA in neuronal cells so this finding is expected. The multiple species versions of miR-124 are present because all Affymetrix GeneChip miRNA arrays provide comprehensive coverage of miRNAs from multiple organisms including human, mouse, rat, canine, monkey, and many more on a single chip. The miRNAs from these different species are highly homologous so probes targeting miRNAs from other species will hybridize with human miRNAs. Therefore, we need to filter the list of miRNAs to include only human miRNAs.
...
Overview
Content Tools