Page History
...
| Numbered figure captions | ||||
|---|---|---|---|---|
| ||||
|

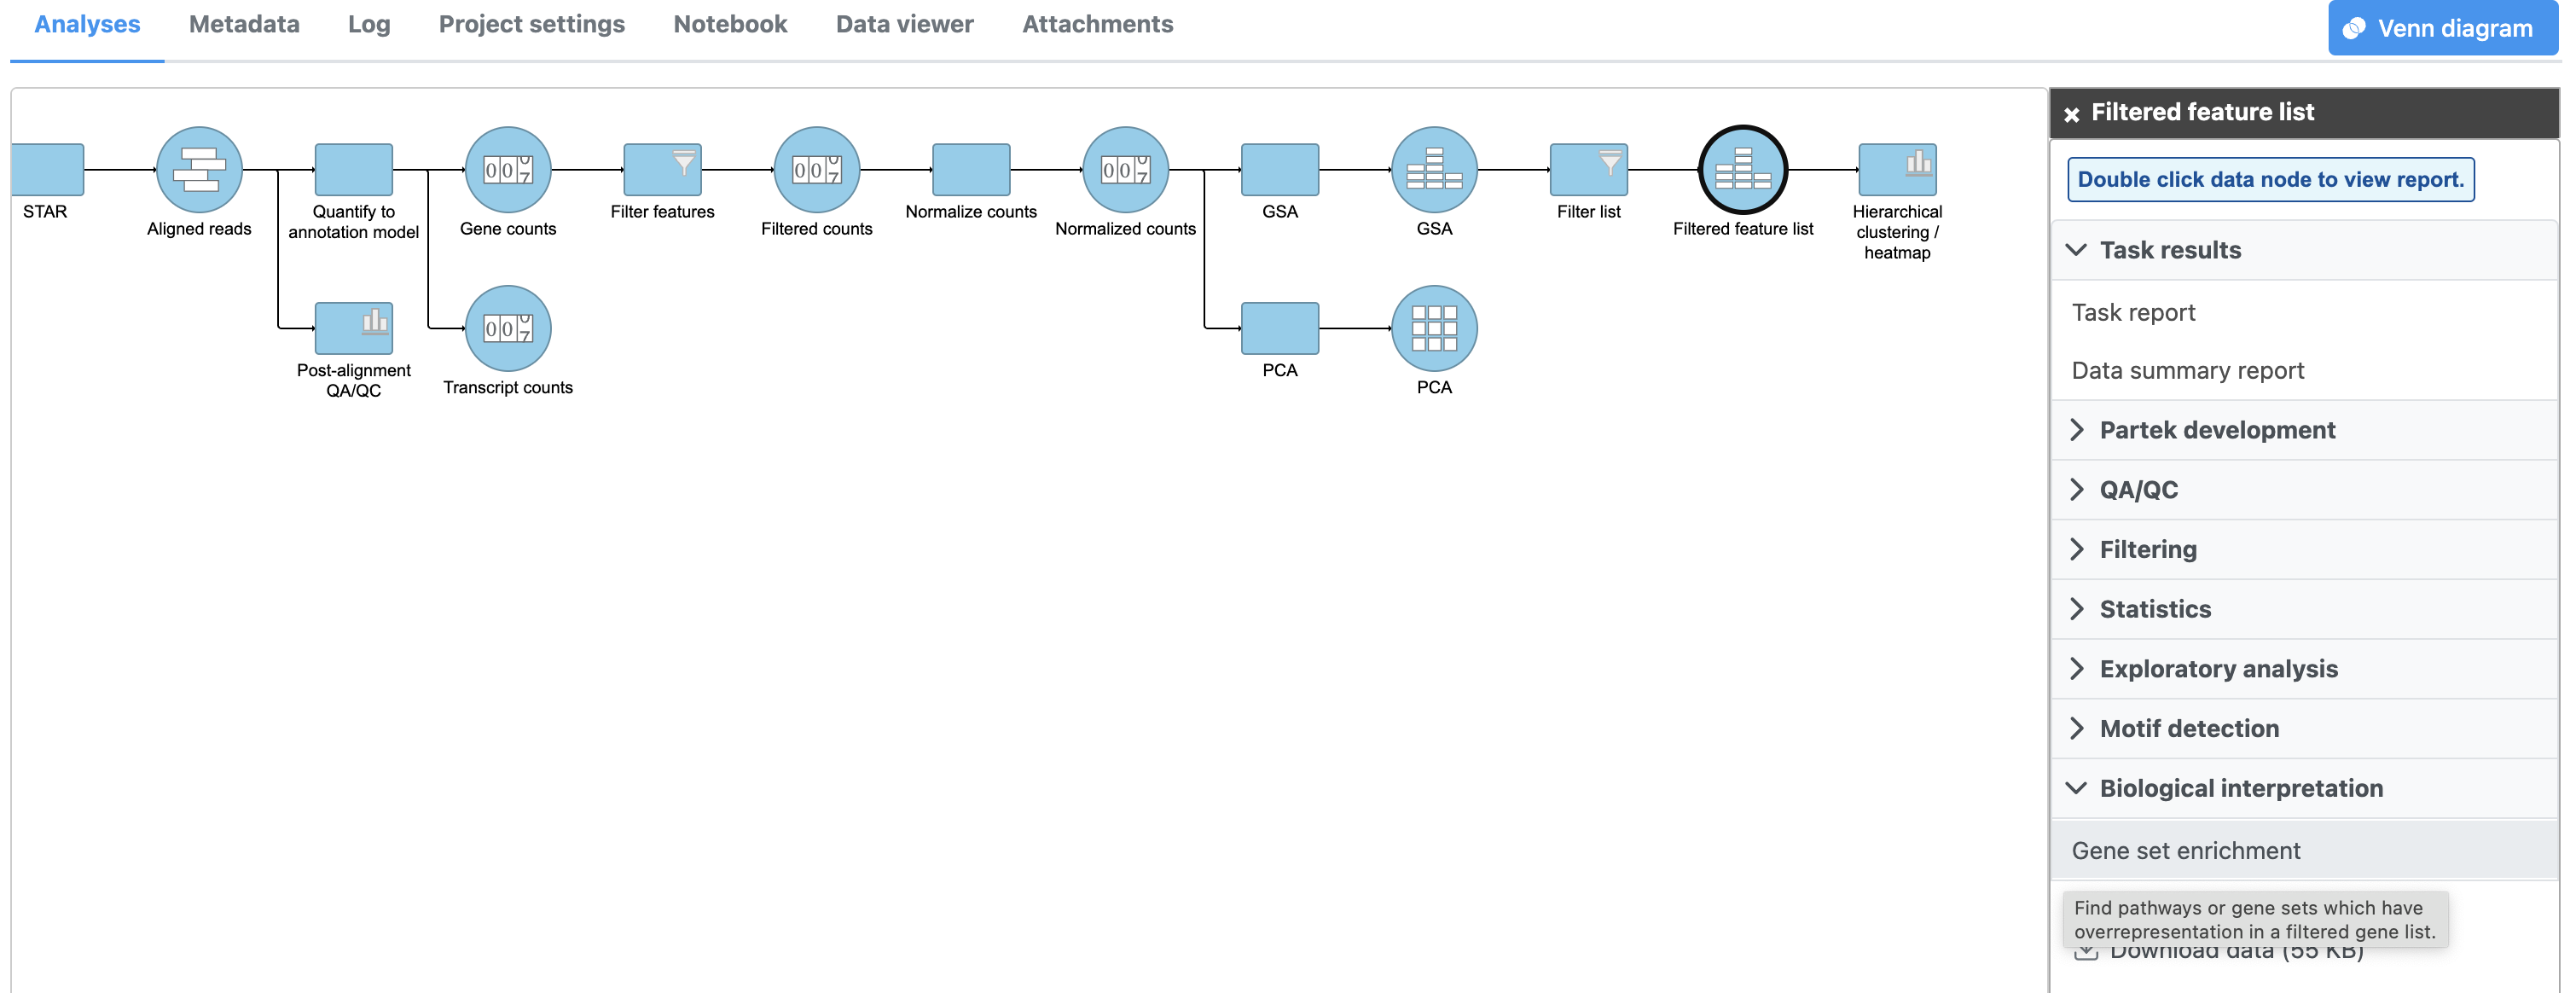
- Select the latest gene set from geneontology.org from the Gene set database drop-down menu
- Click Finish
...
| Numbered figure captions | ||||
|---|---|---|---|---|
| ||||
|

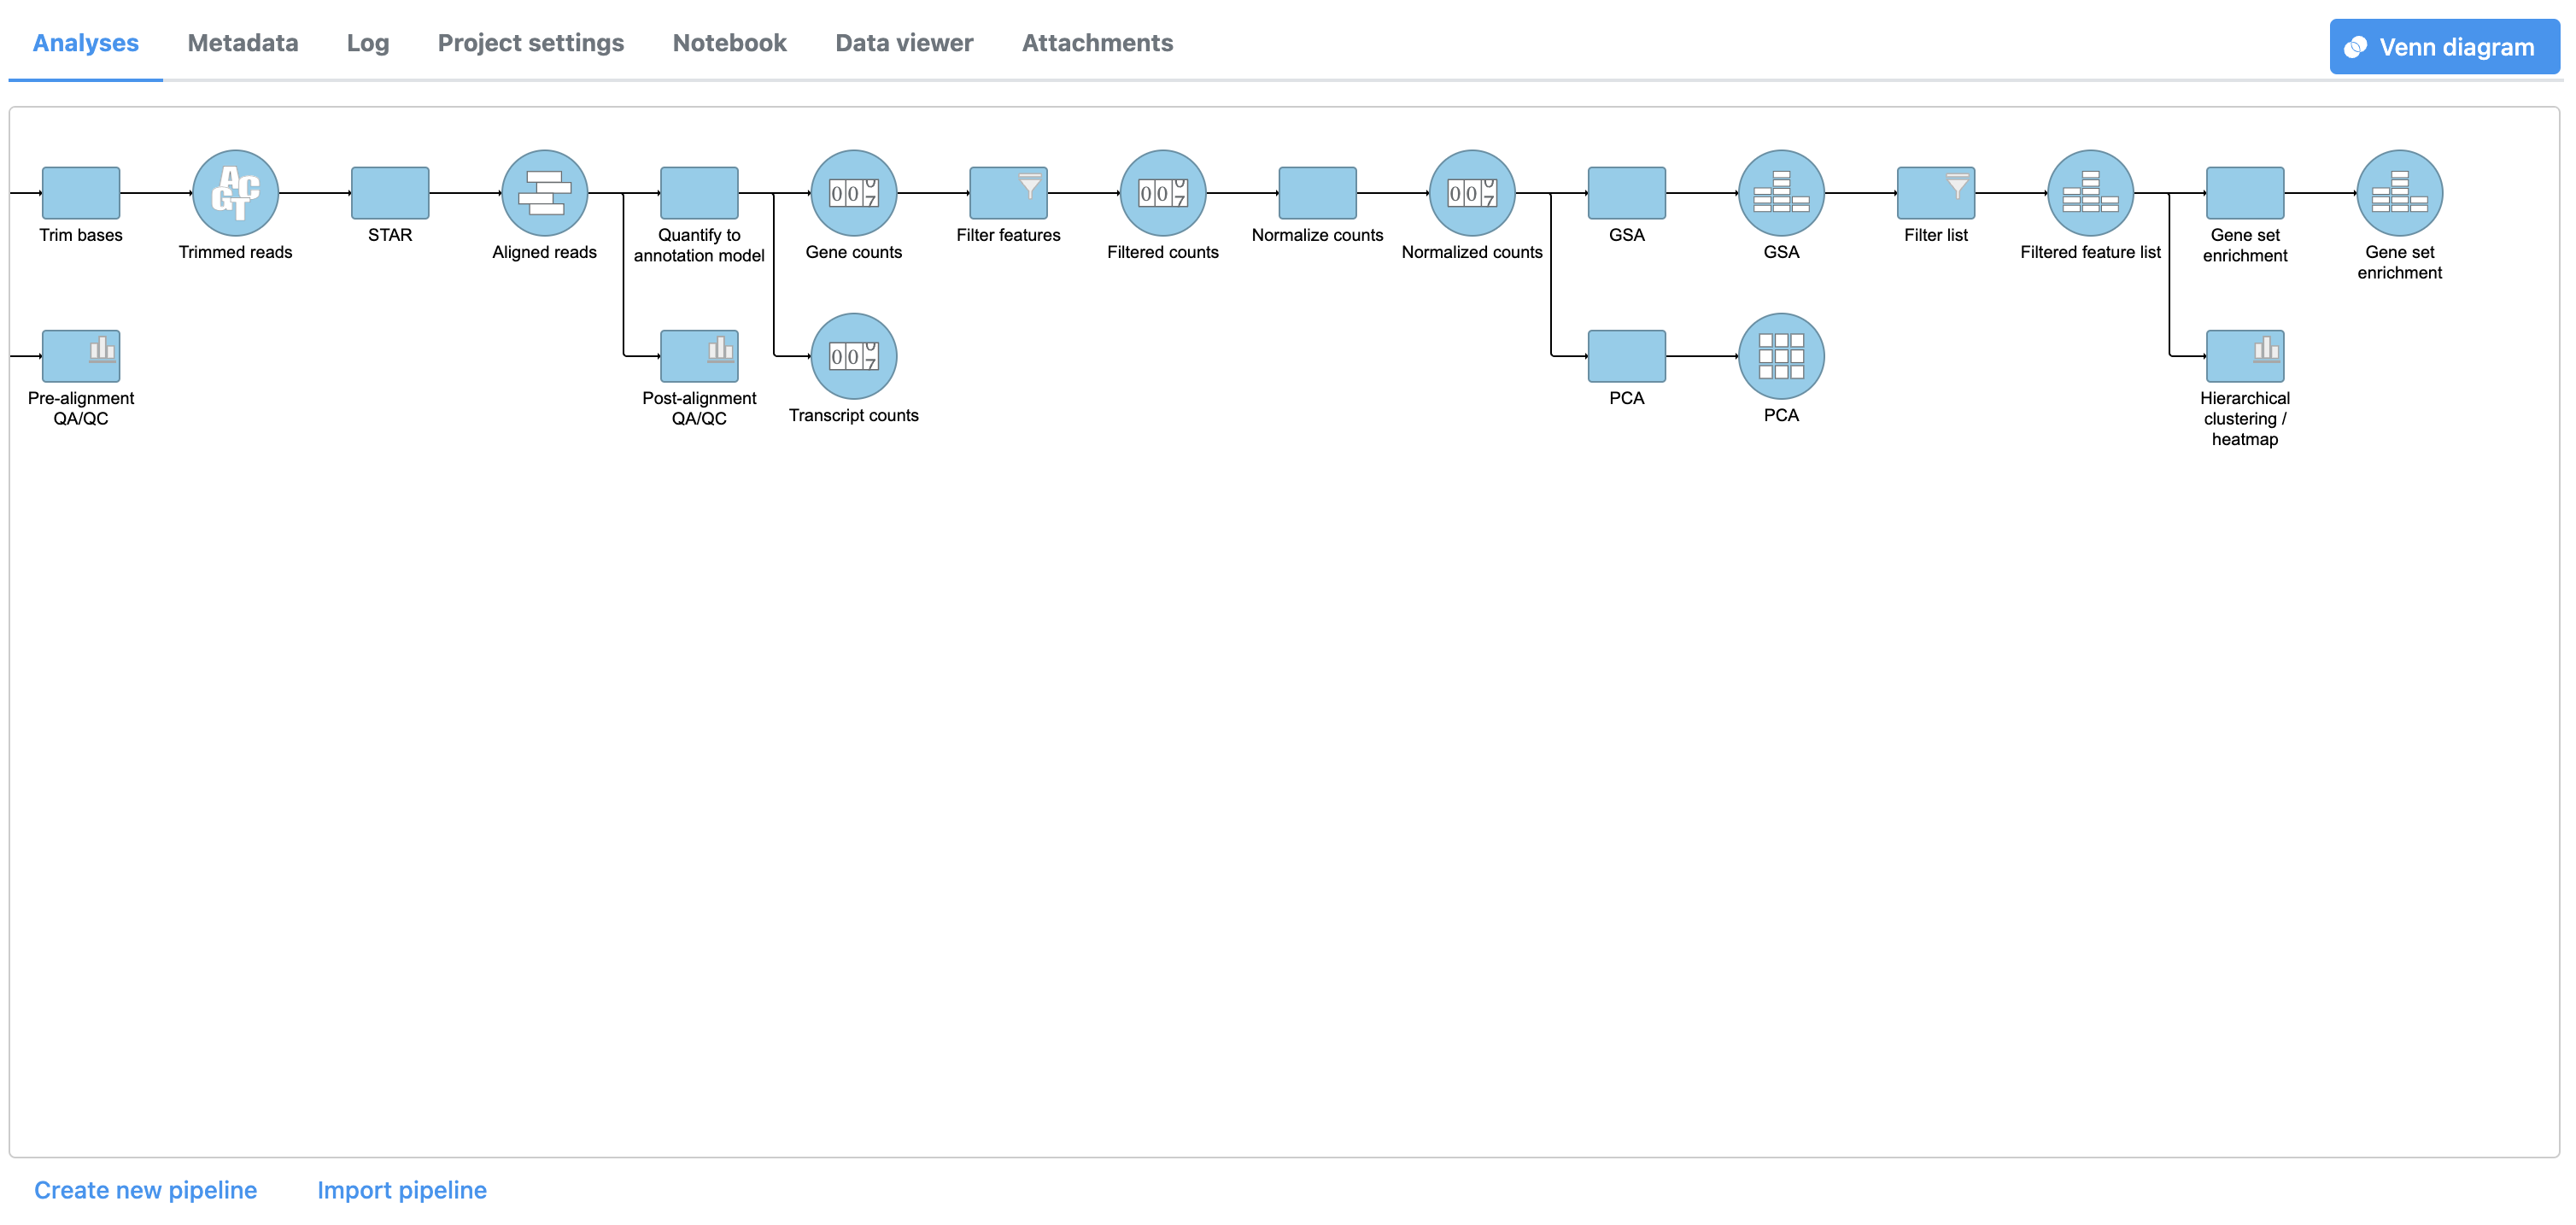
- Double-click the Gene set enrichment task node to open the task report (Figure 3)
| Numbered figure captions | ||||
|---|---|---|---|---|
| ||||
|

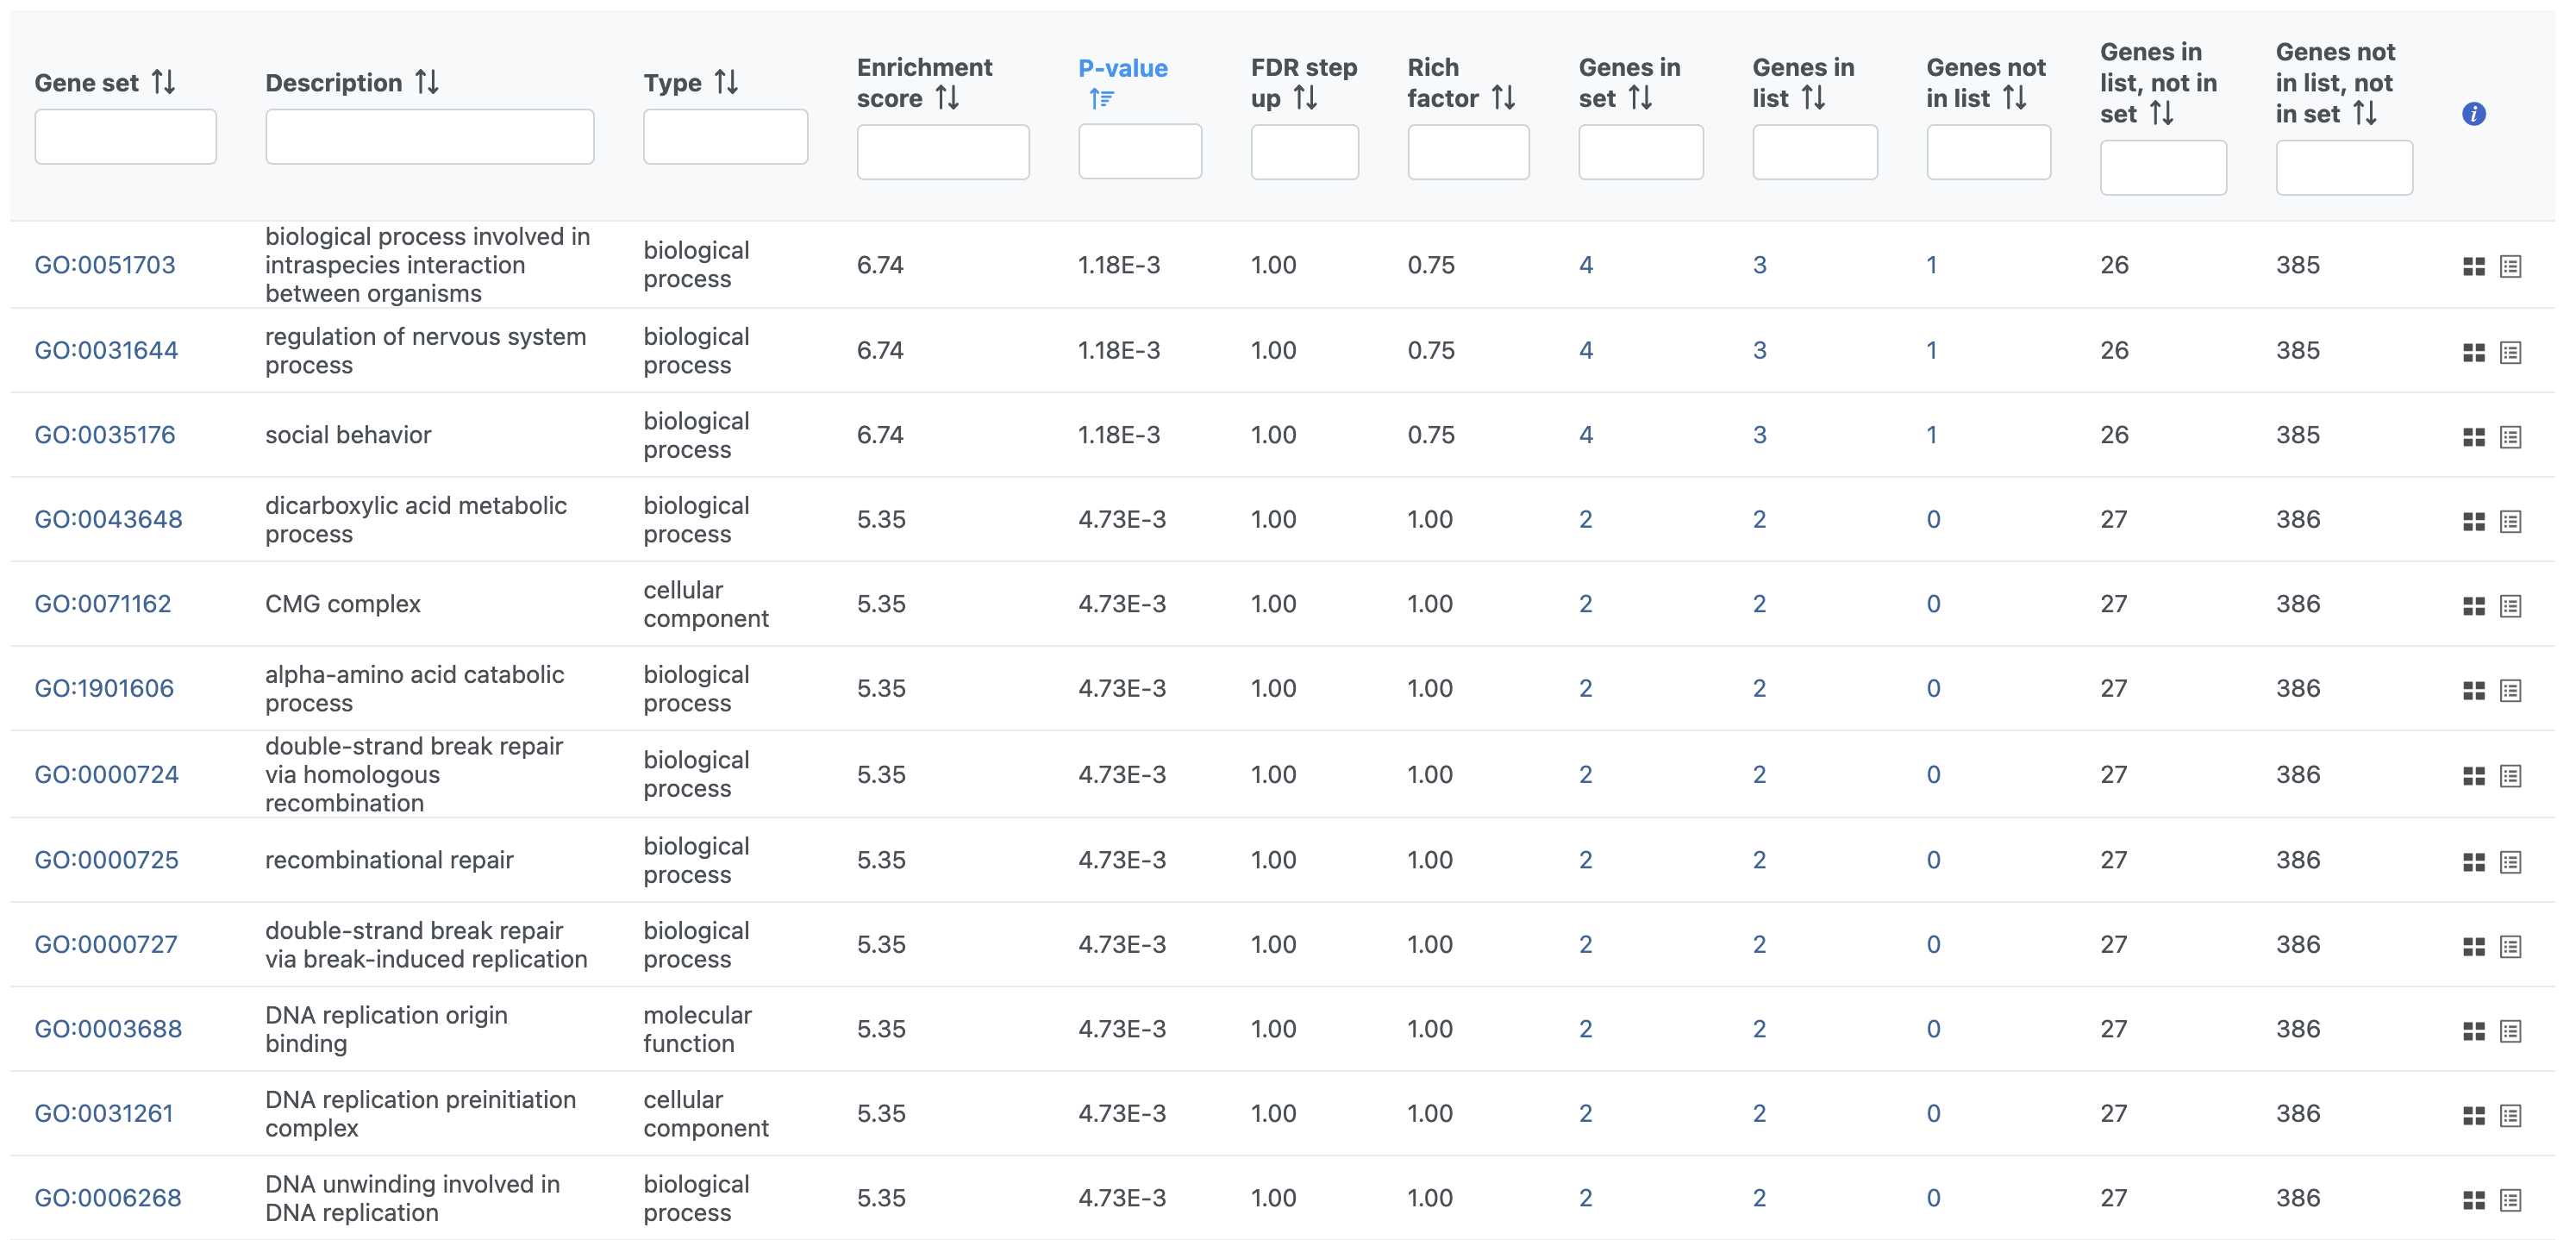
The GO enrichment task report spreadsheet lists GO terms by ascending p-value with the most significant GO term at the top of the list. Also included are the enrichment score, the number of genes from that GO term in the list, and the number of genes from that GO term that are not in the list.
...
| Numbered figure captions | ||||
|---|---|---|---|---|
| ||||
|

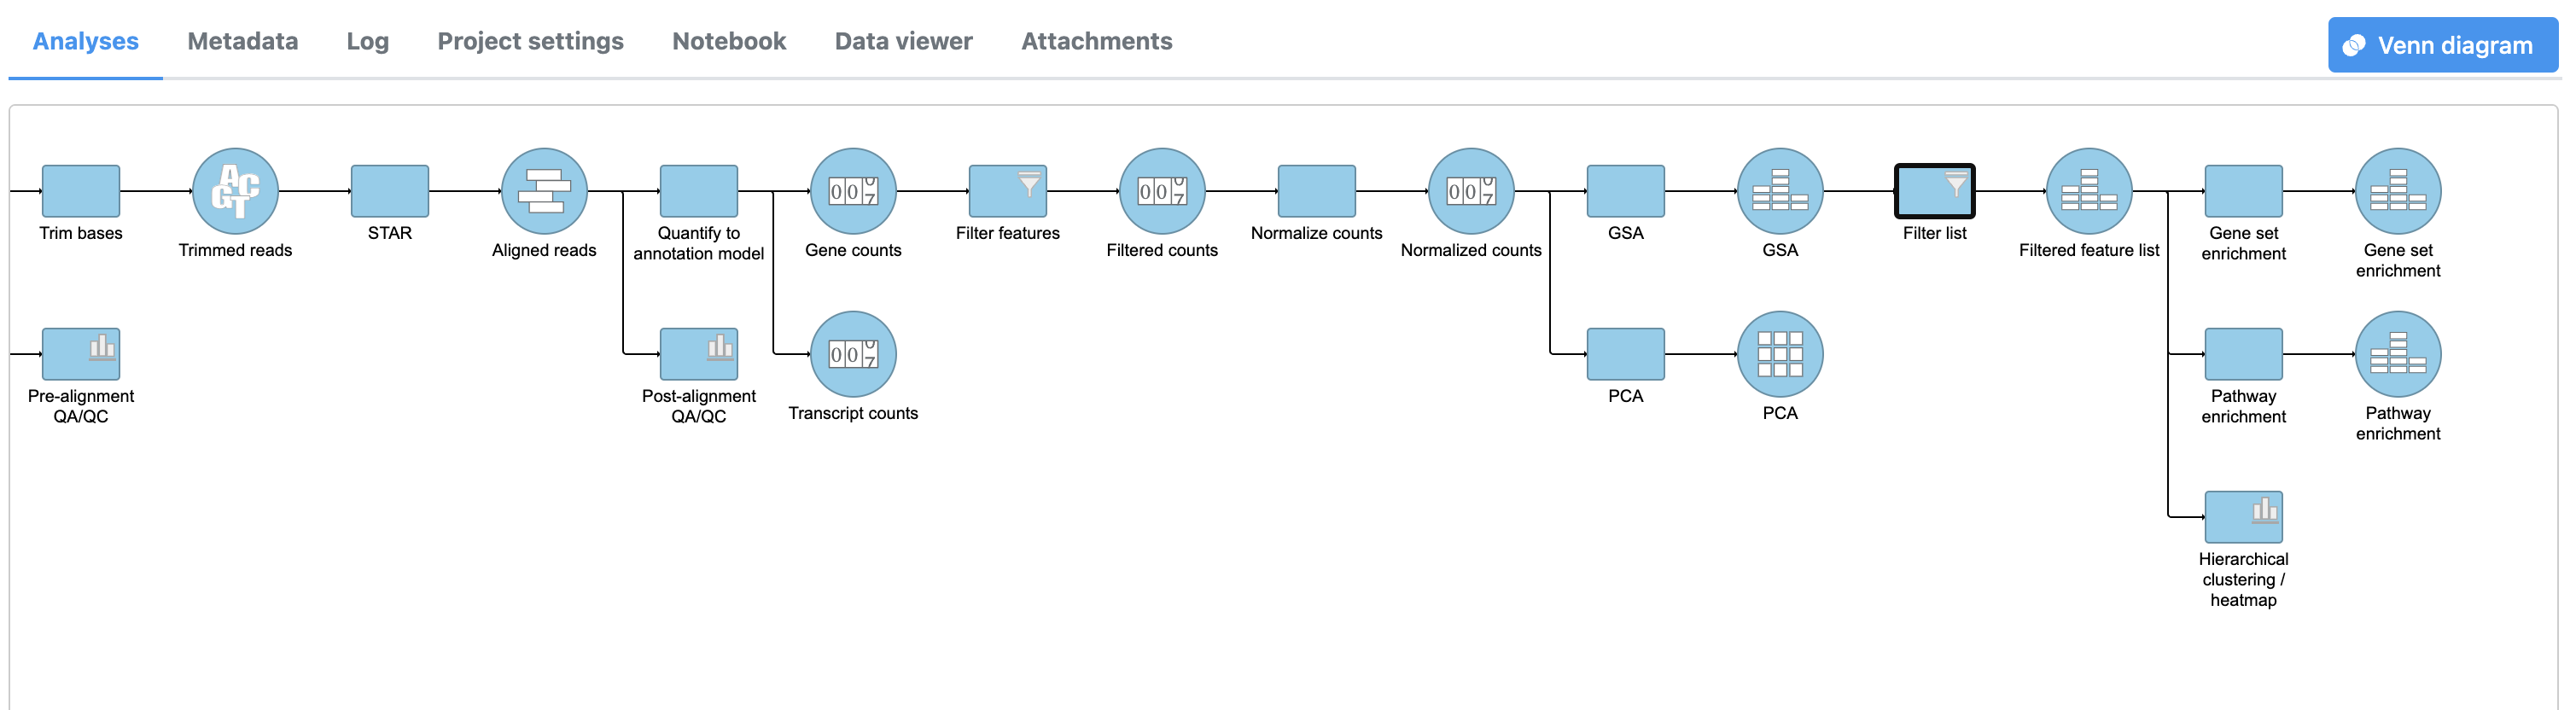
- Double-click the Pathway enrichment task node to open the task report
...
| Numbered figure captions | ||||
|---|---|---|---|---|
| ||||
|

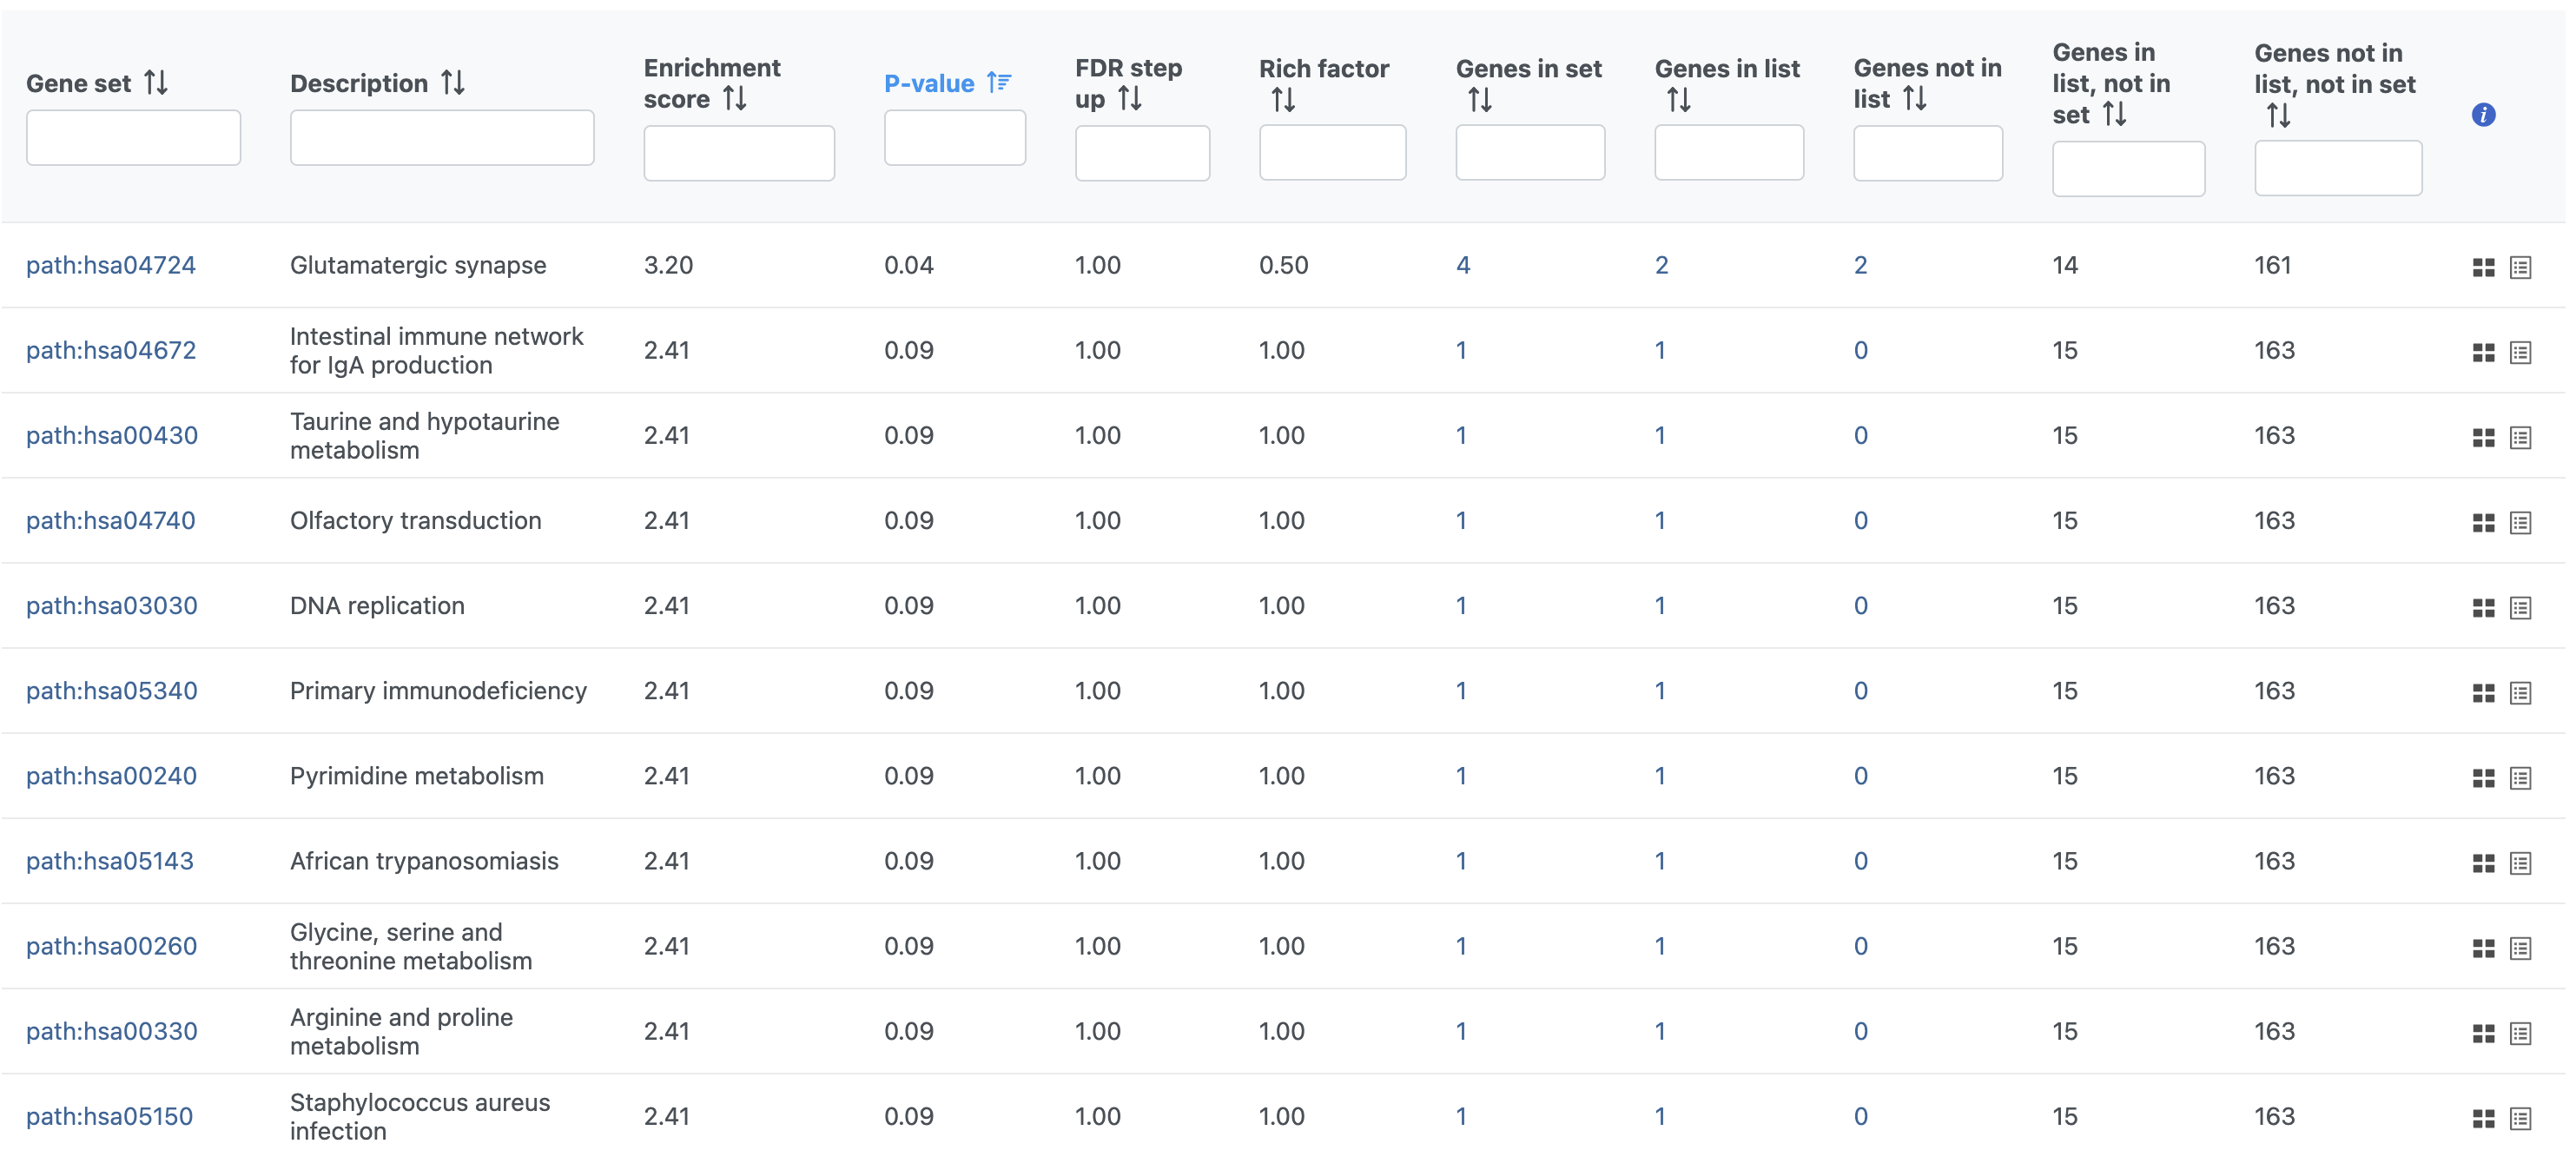
To view an interactive KEGG pathway map, click the pathway ID (Gene set column).
...
Overview
Content Tools