Page History
...
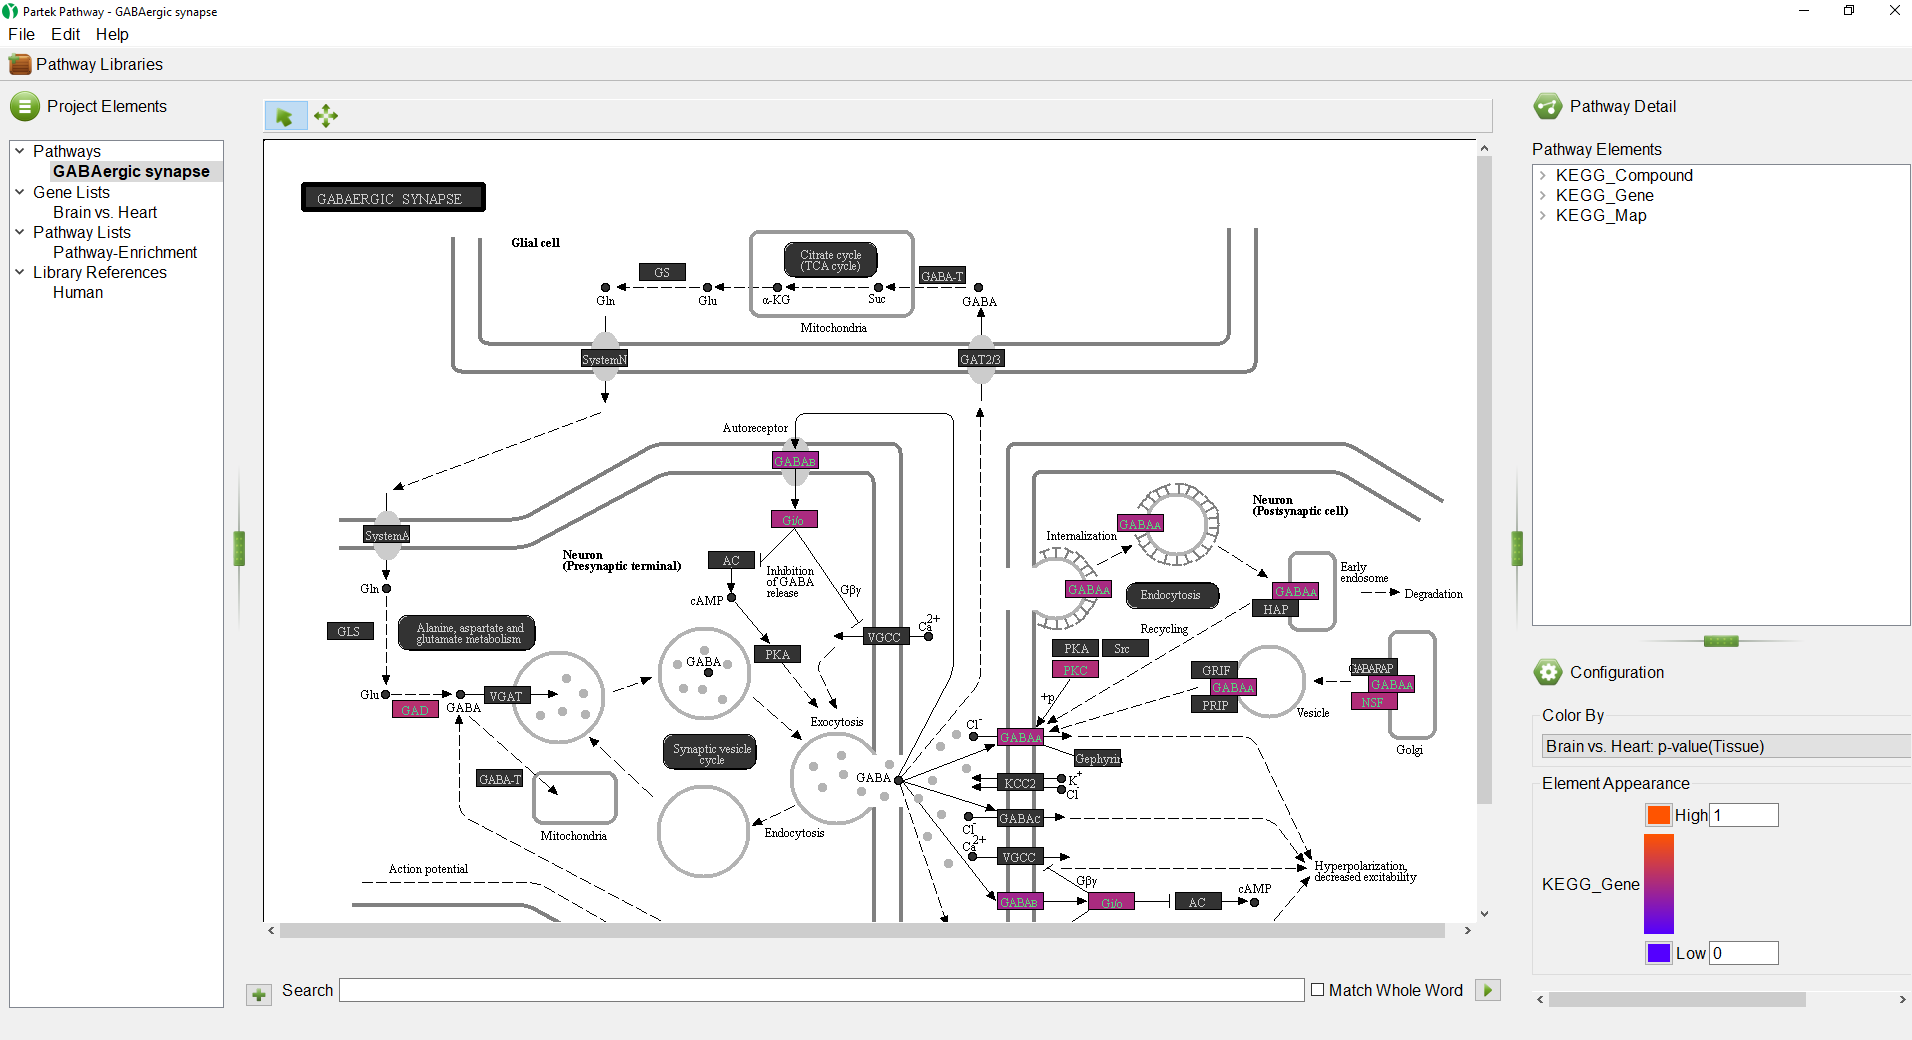
Partek Pathway is a standalone program from Partek Genomics Suite with a distinct user interface (Figure 1). The size of each panel can be adjusted using the green vertical and horizontal grab bars.
| Numbered figure captions | ||||
|---|---|---|---|---|
| ||||
|
| Numbered figure captions | ||||
|---|---|---|---|---|
| ||||
|
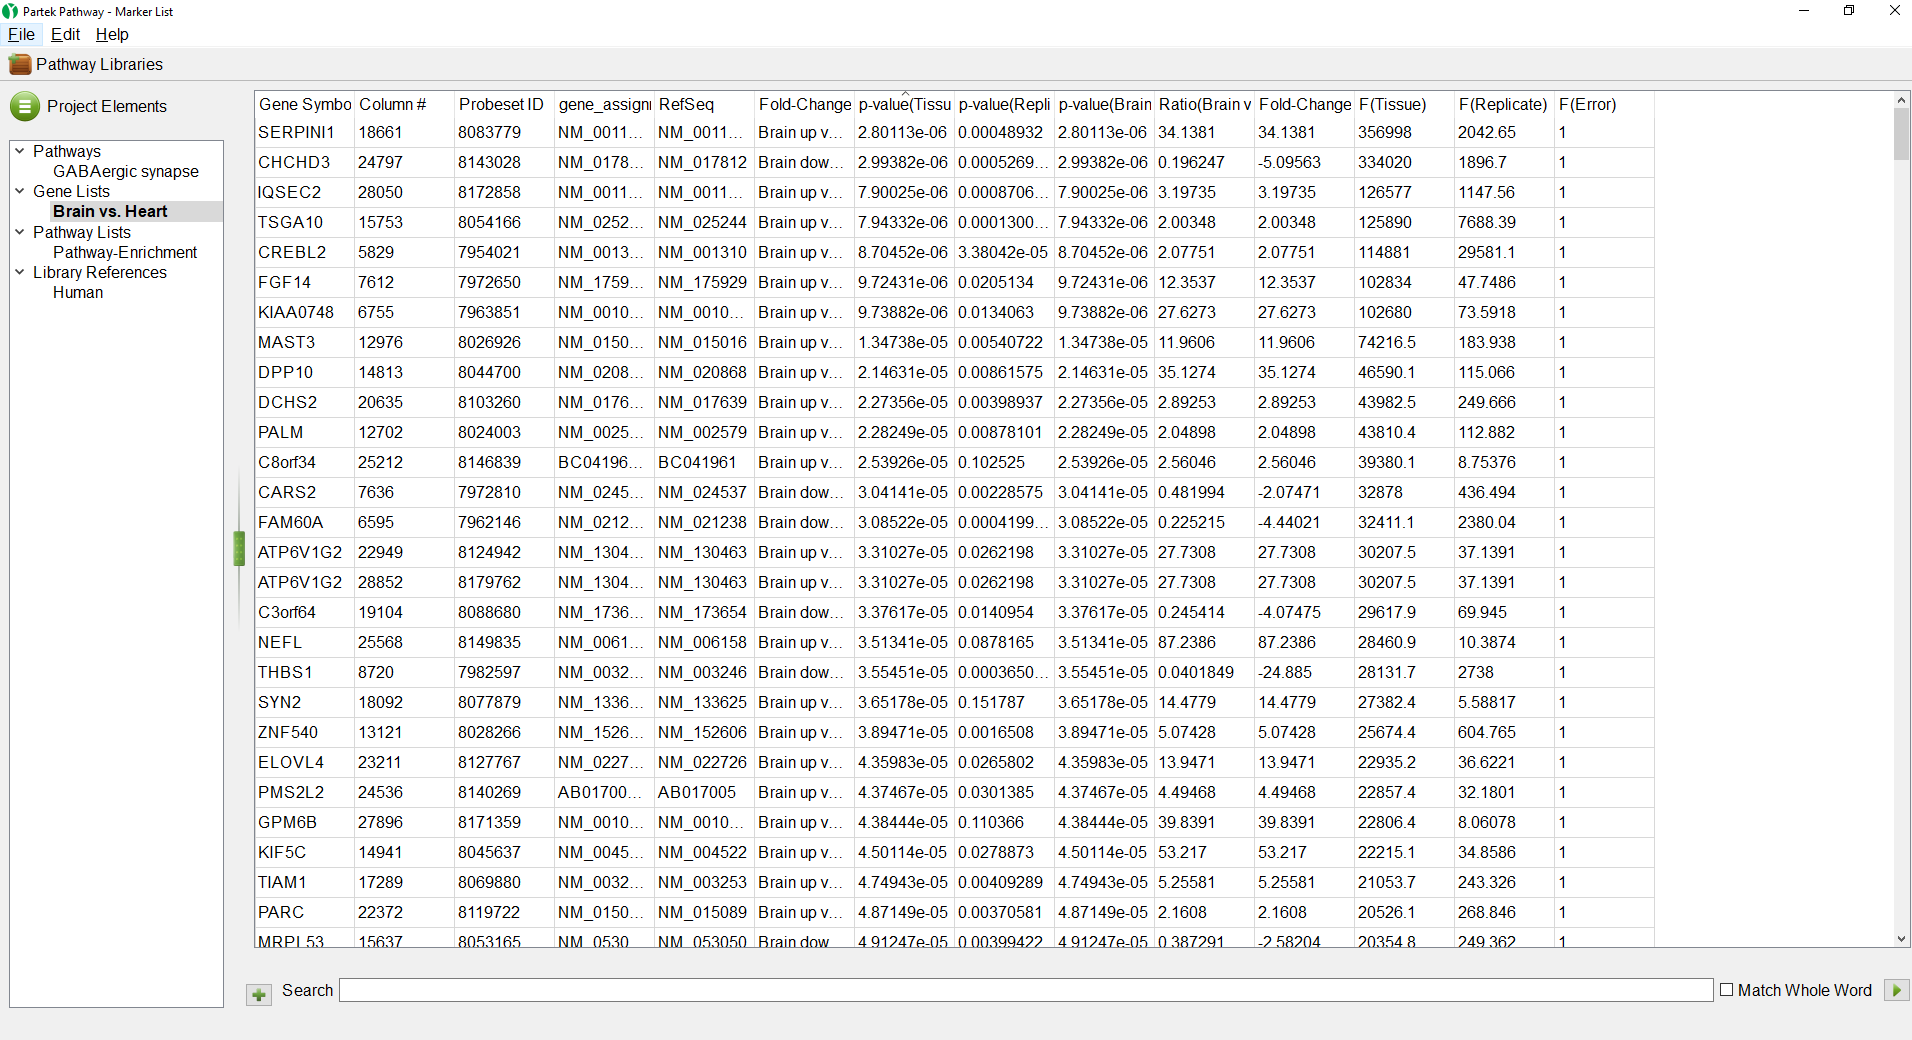
- Select the Brain vs. Heart spreadsheet under Gene Lists
The Brain vs. Heart gene list we created earlier will open (Figure 3). The spreadsheet can be sorted by any column by left-clicking a column header; the first click will sort by ascending values, the second click will switch to descending values.
| Numbered figure captions | ||||
|---|---|---|---|---|
| ||||
|
...
The Pathway-Enrichment.txt spreadsheet also seen in Partek Genomics Suite will open (Figure 4). Selecting any of the pathway names will open its pathway diagram. The spreadsheet can be sorted by any column.
| Numbered figure captions | ||||
|---|---|---|---|---|
| ||||
|
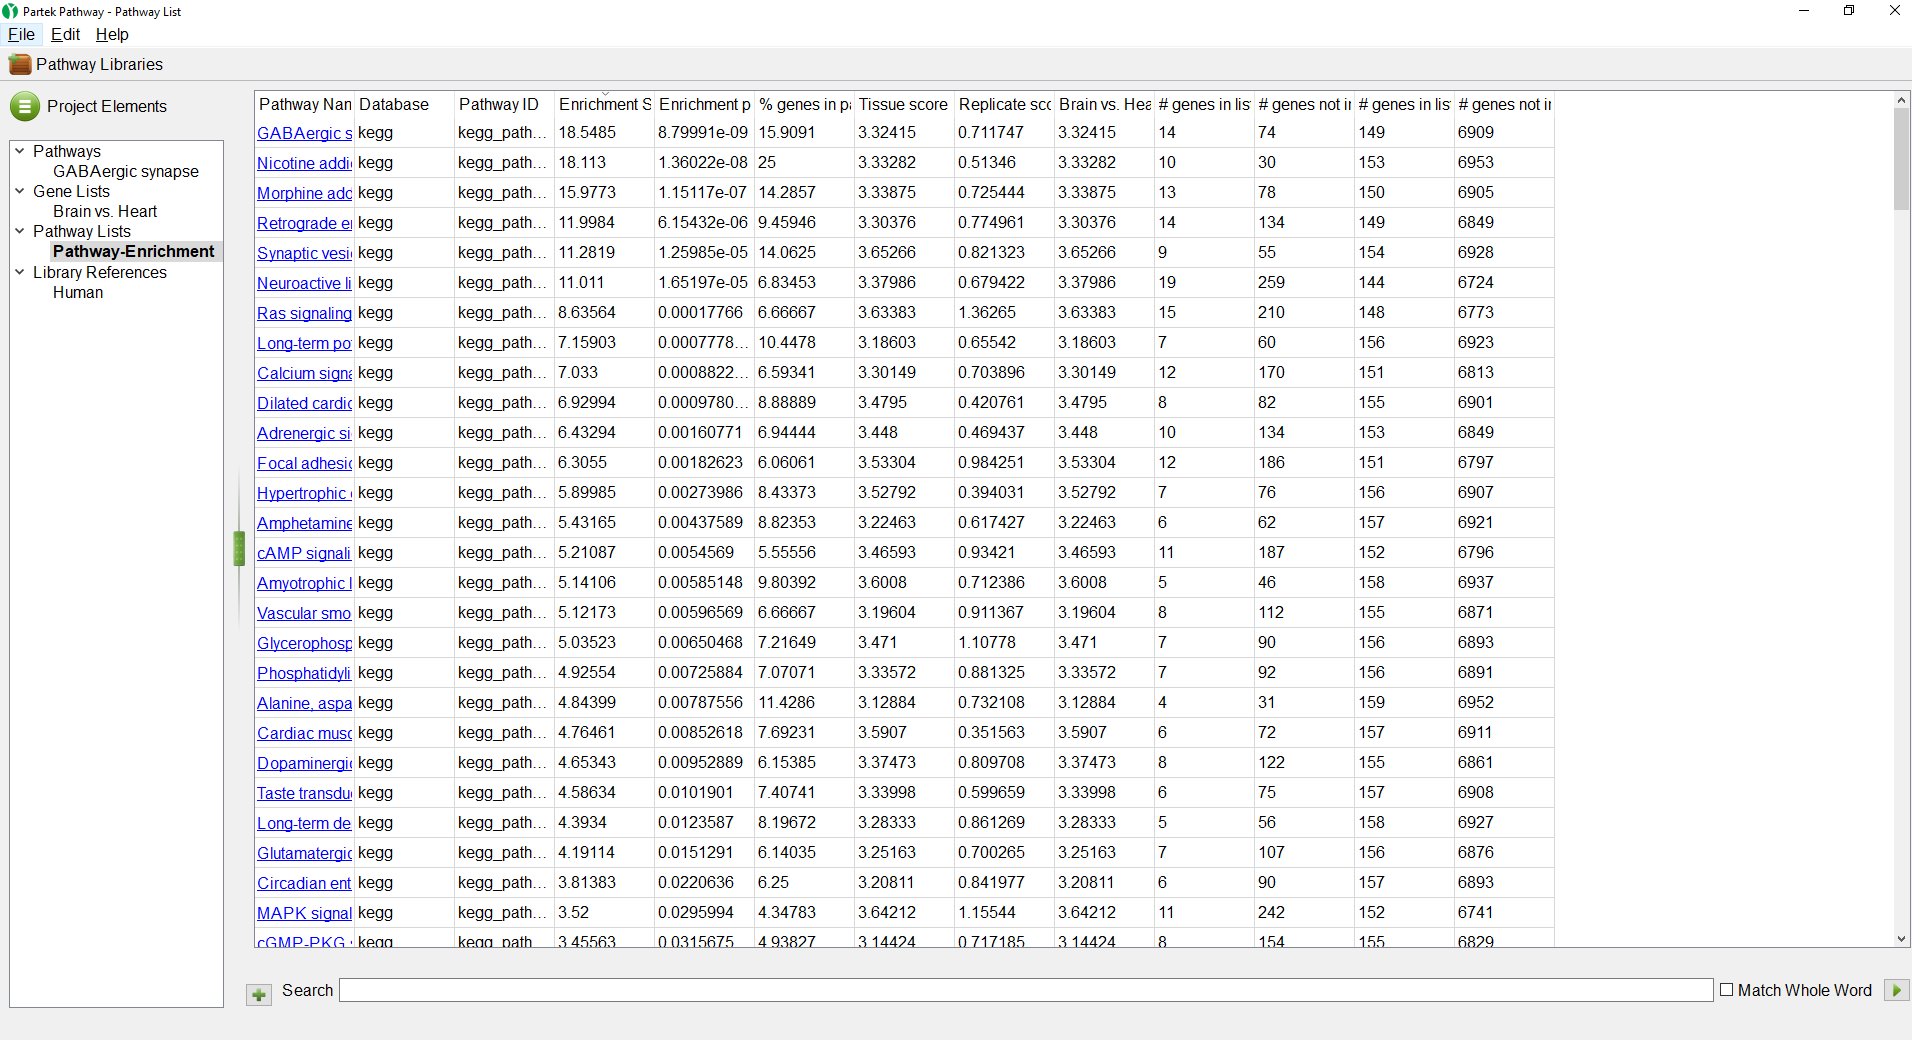
- Select the GABAergic synapse pathway on the Pathway-Enrichment spreadsheet or the Project Elements panel
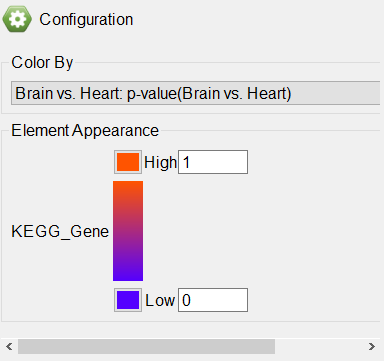
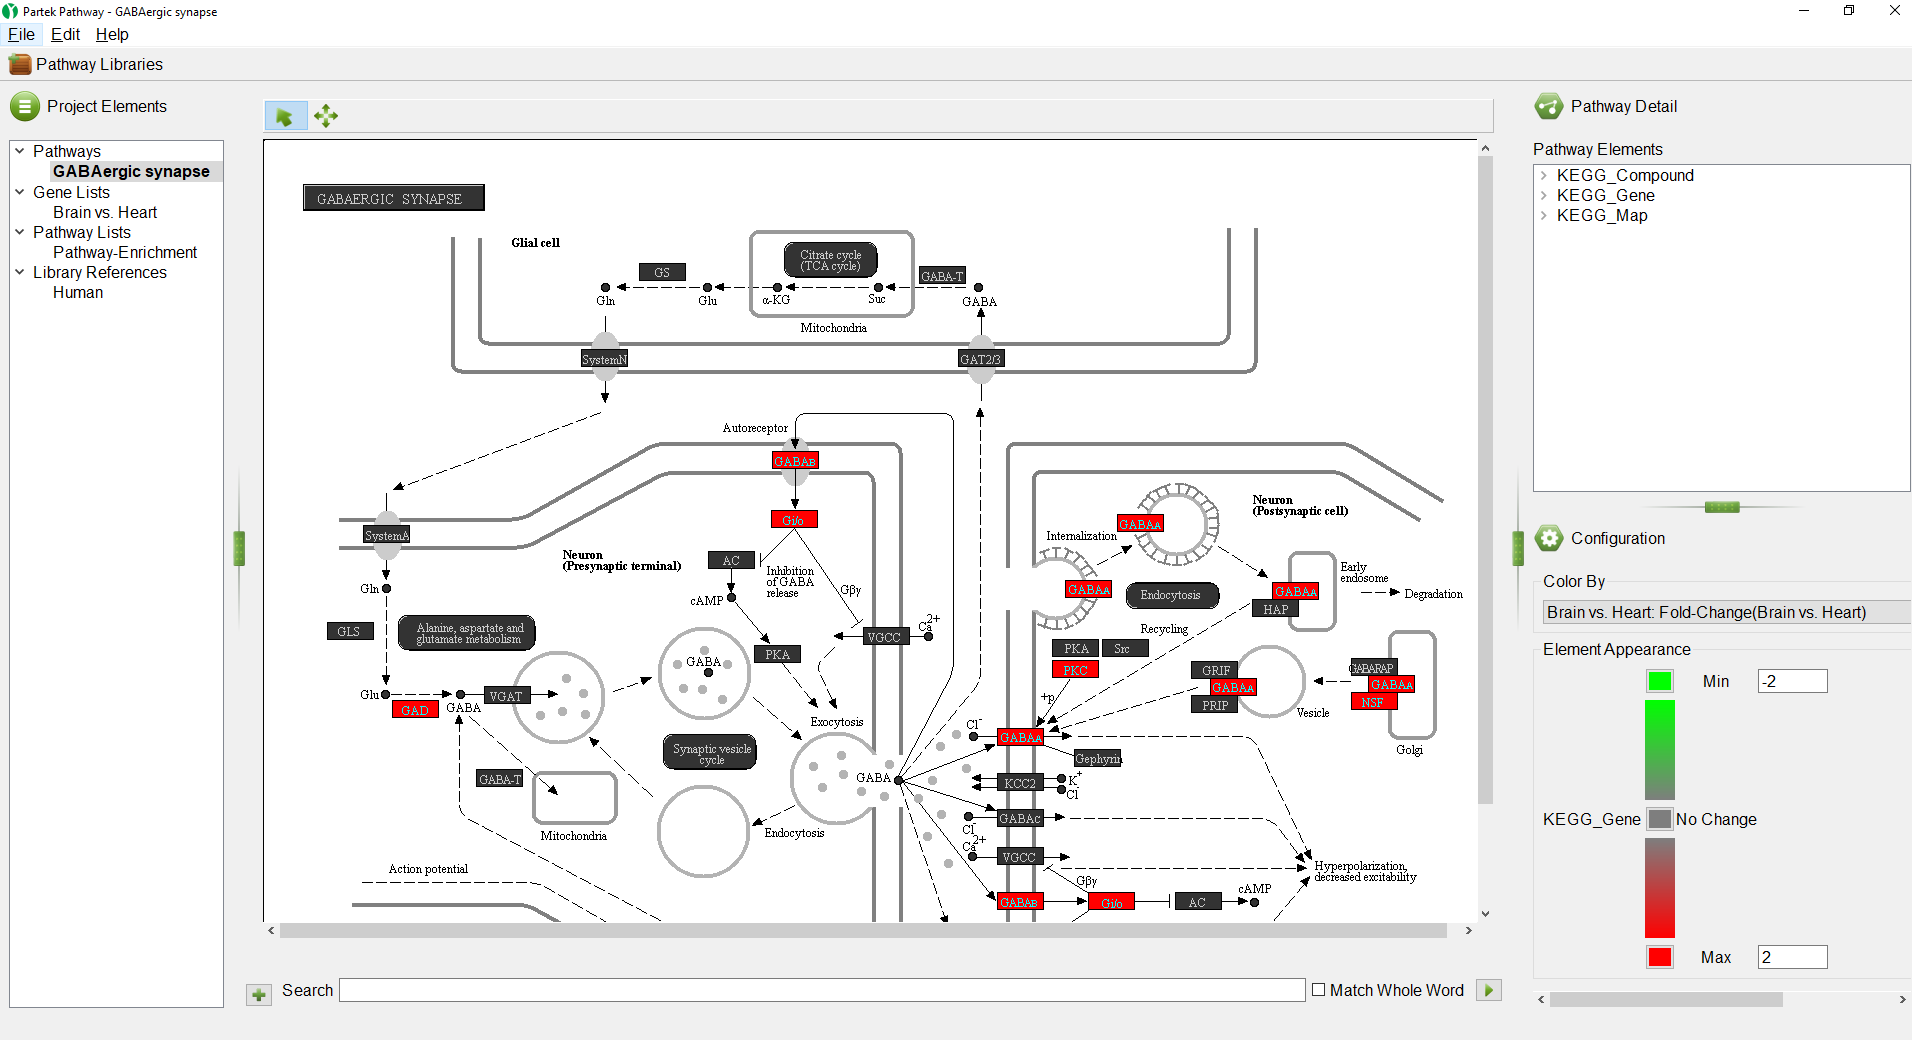
The GABAergic synapse pathway diagram will open. Genes in the pathway are shown as boxes. The color of the box is set by the Configuration panel (Figure 5).
| Numbered figure captions | ||||
|---|---|---|---|---|
| ||||
|
...
The pathway diagram now shows fold change for each gene in the pathway included in the gene list (Figure 6). Genes not in the gene list remain black.
| Numbered figure captions | ||||
|---|---|---|---|---|
| ||||
|
The colors and range of can be changed using the Color By panel.
...
We can see that all the colored genes in the GABAergic synapse pathway are yellow (Figure 7), indicating that they are upregulated.
| Numbered figure captions | ||||
|---|---|---|---|---|
| ||||
|
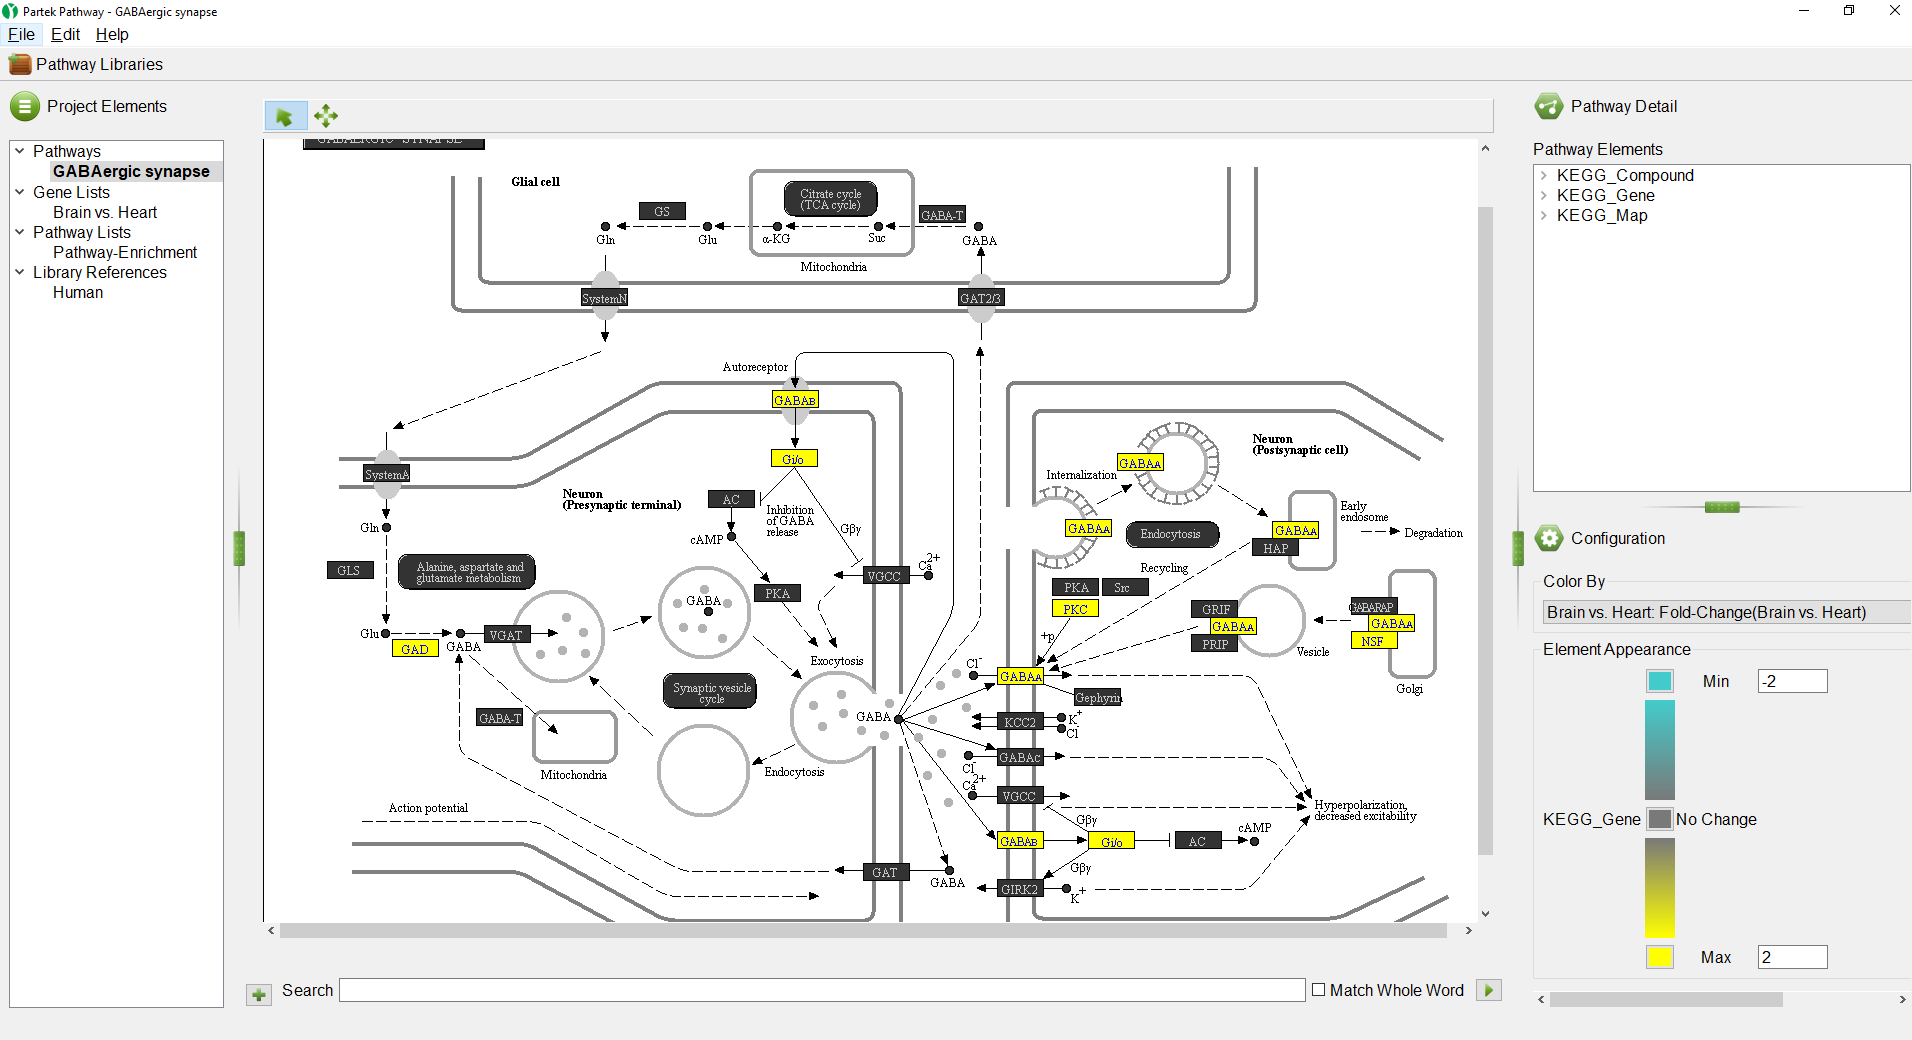
We can select a gene to learn more.
...
Overview
Content Tools