Page History
...
| Numbered figure captions | ||||
|---|---|---|---|---|
| ||||
|
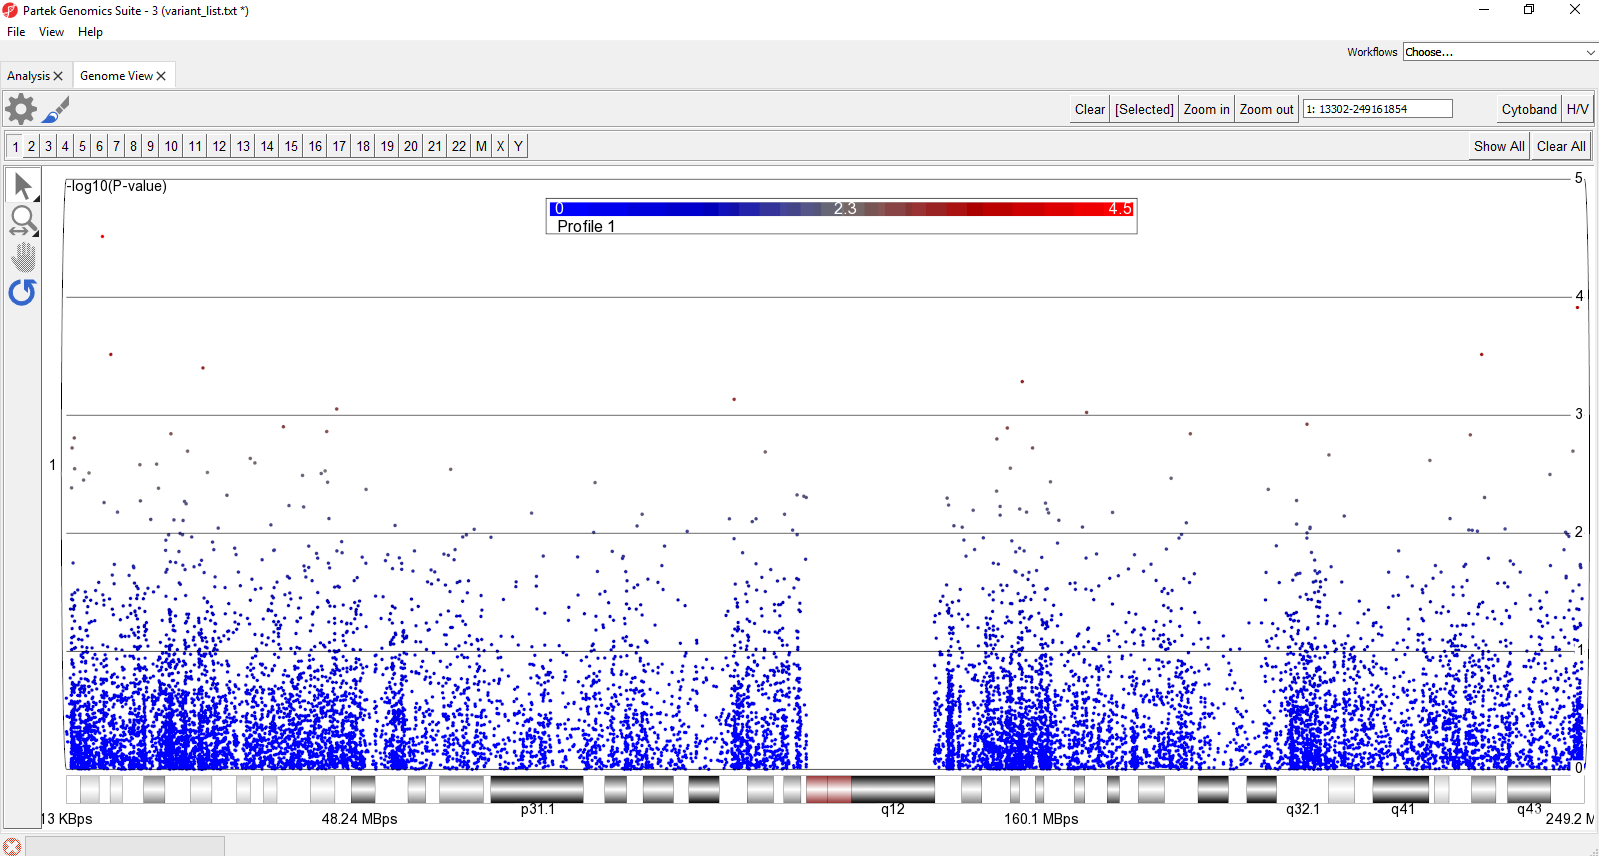
- Select Show All in the upper-right hand corner of the plot
This displays all chromosomes vertically. We can display them horizontally for a better view.
- Select
 to open the Configure Plot dialog
 - Select Genome in line for Layout
- Select OK
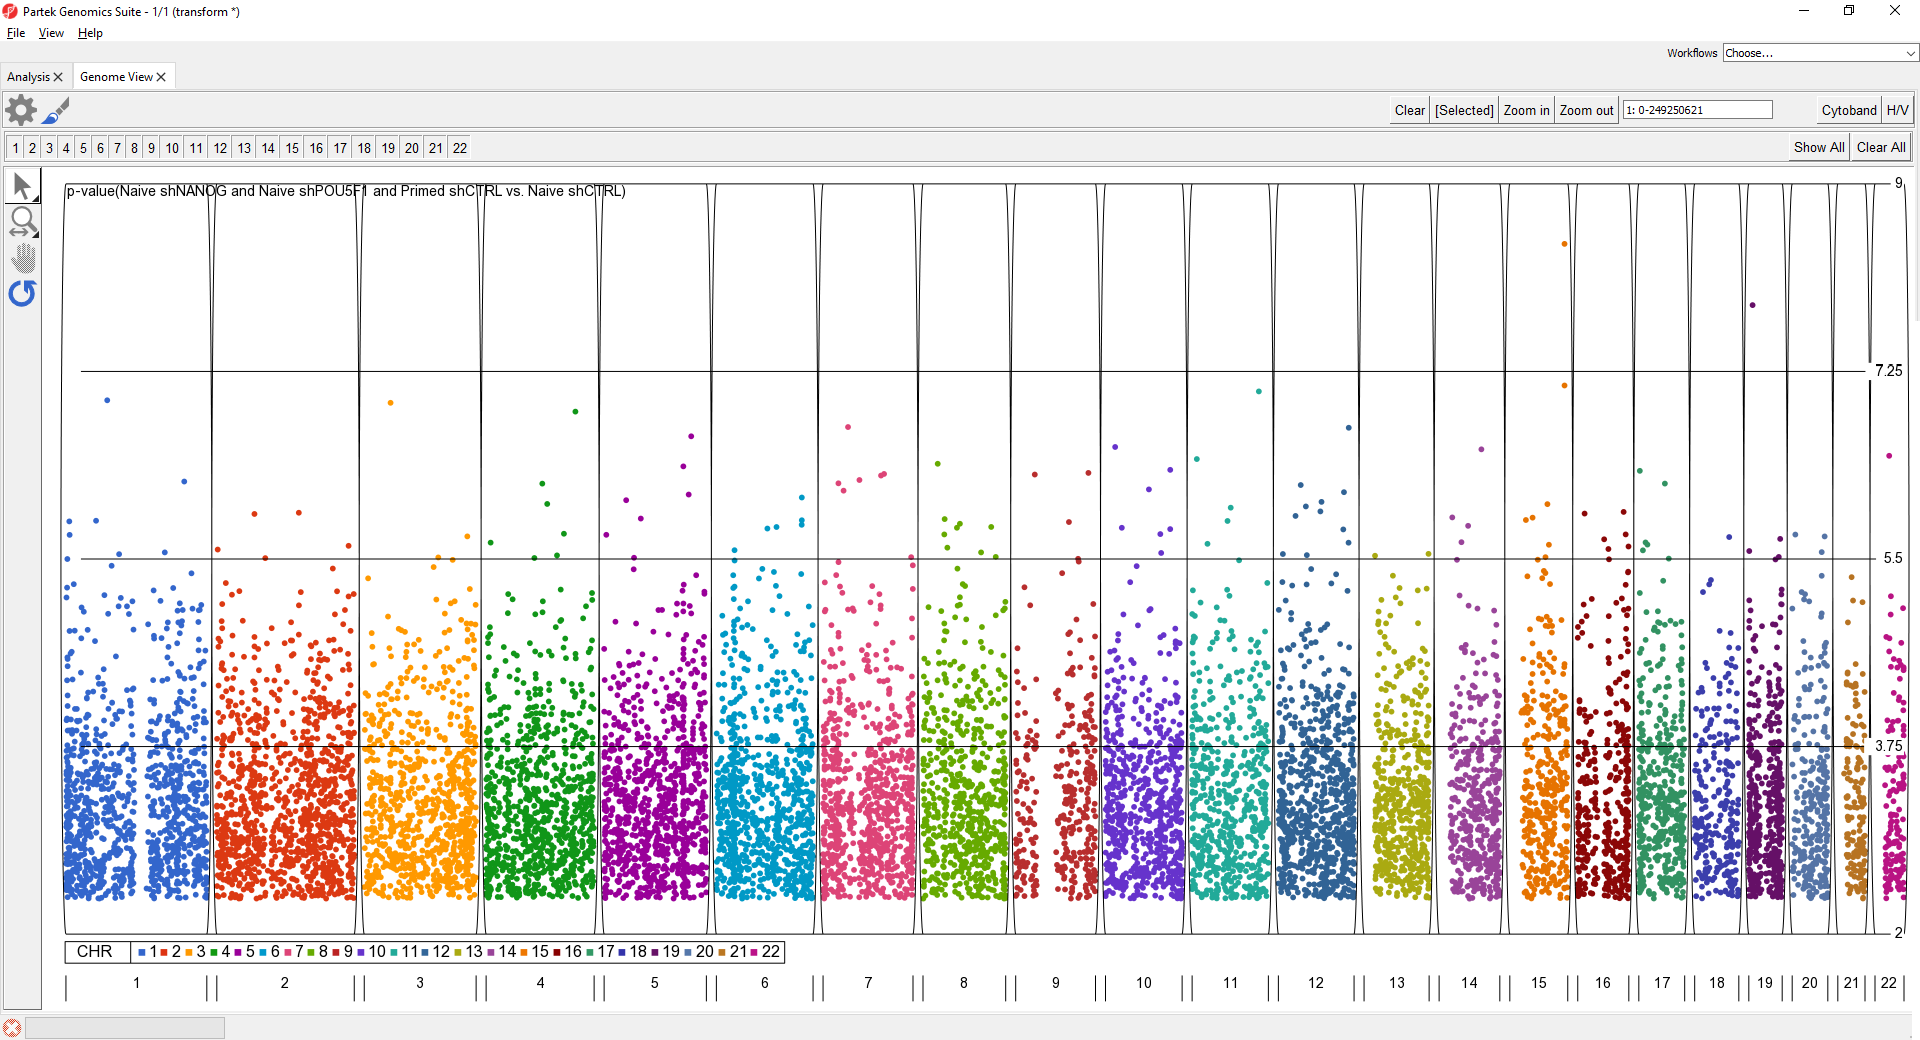
To further improve the genome-wide view, we can remove the cytoband, remove the genomic position label, color points by chromosome, and increase point size.
- Select Cytoband in the upper right-hand corner
- Select

- Deselect Show Base Pair Labels
- Select Profiles
- Select Configure
- Set Color By to a column with chromosome for each SNP/loci as a category
- Set Shape Size to 5.0
- Select OK to close the Configure Profile dialog
- Select OK to apply changes
The plot will appear as shown (Figure 2).
| Numbered figure captions | ||||
|---|---|---|---|---|
| ||||
|
For details on Genome View see Chapter 6: The Pattern Visualization System in the Partek User's Manual.
...
Overview
Content Tools