Page History
...
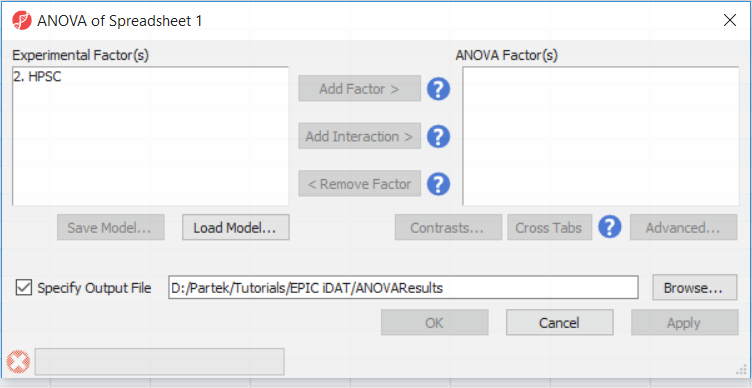
- Select Defect Differential Methylation from the Analysis section of the Illumina BeadArray Methylation workflow
- Select 2. State and 3. shRNA treatment from the Experimental Factor(s) panel of the ANOVA of Spreadsheet 1 dialogby holding the Ctrl key on your keyboard and selecting both items
- Select Add Factor > to move 2. State State and 3. shRNA treatment to the ANOVA Factor(s) panel
- Repeat for 3. shRNA treatment
- Select 2. State and 3. shRNA treatment from the Experimental Factor(s) panel by holding the Ctrl key on your keyboard and selecting both Select Add Interaction > to add the interaction between 2. State State and 3 3. shRNA treatment
- Select Contrasts...
...
- (Figure 1)
...
| Numbered figure captions | ||||
|---|---|---|---|---|
| ||||
|
- Select Contrasts...
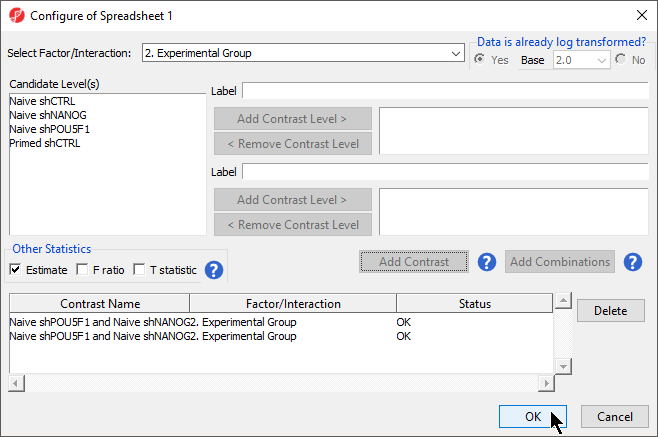
- Select Yes for Data is already log transformed?
- Select 2. State * 3. shRNA treatment from the Select Factor/Interaction drop-down menu
- Select all four options in the Candidate Level(s) panel by selecting each while holding the Ctrl key on your keyboard
- Select Add Contrast Level > for Group 1
- Repeat steps to add all four options to Group 2
- Select Add Combination
- Select OK to close the Configuration dialog
- Select OK to close the ANOVA dialog and run the ANOVA
Depending on the data in the top level (i.e. parent) spreadsheet you may need to manually specify whether the data is already log transformed: you should select Yes for M-values, as they are based on logit transformation (Figure 2). By default, Partek Genomics Suite will calculate fold-change value for each contrast and, in addition to that, if you want to include the difference in methylation levels between the groups at each CpG site in the output, check the Estimate box in the Other Statistics section of the dialog (Figure 2). The setup of the contrasts has implications on downstream steps, in particular on filtering the differentially methylated loci.
...
Overview
Content Tools