...
| Numbered figure captions |
|---|
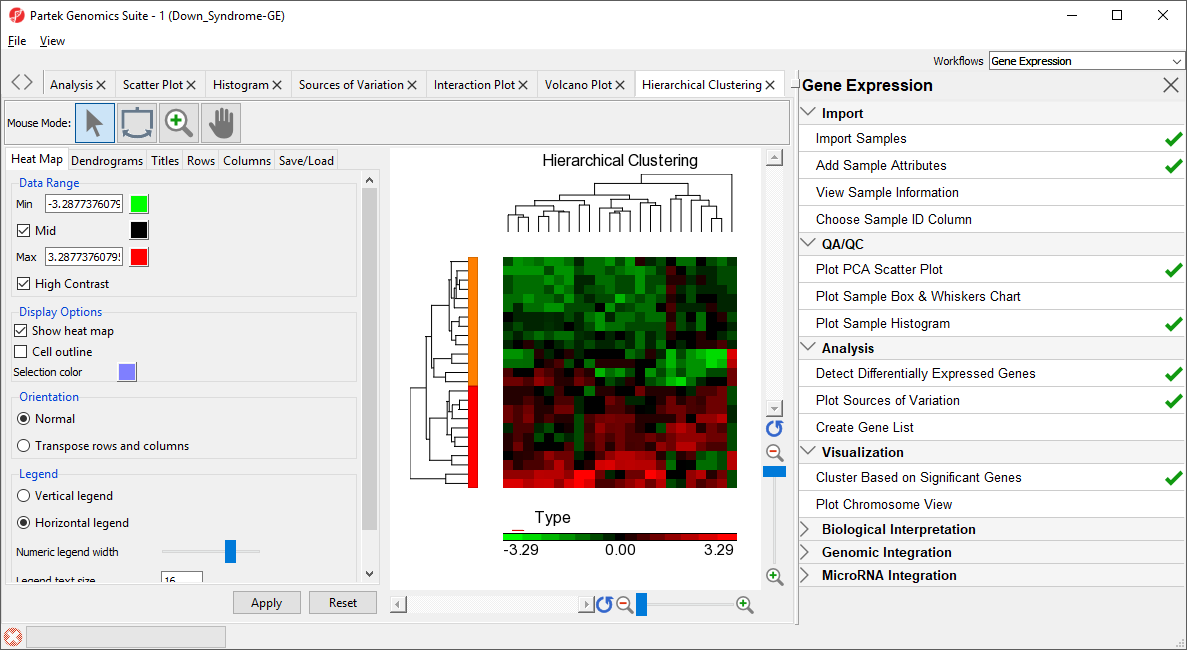
| SubtitleText | Hierarchical Clustering of Down_Syndrome_vs_Normal (A) |
|---|
| AnchorName | Hierarchical Clustering |
|---|
|
|
The graph (Figure 2) illustrates the standardized gene expression level of each gene in each sample. Each gene is represented in one column, and each sample is represented in one row. Genes
which are unchanged are with no difference in expression have a value of zero and are colored black. Genes with increased expression
in Down syndrome samples have positive values and are colored red. Genes with reduced expression
in Down syndrome samples have negative values and are colored green. Down syndrome samples are colored red and normal samples are colored orange. On the left-hand side of the graph, we can see that the Down syndrome samples cluster together.
...
| Numbered figure captions |
|---|
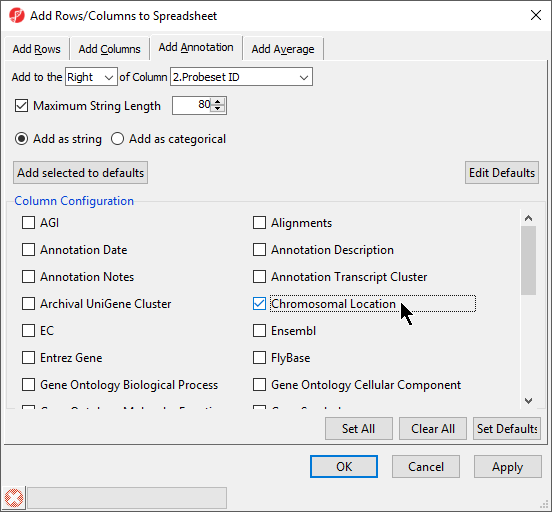
| SubtitleText | Adding Chromosomal Location annotation |
|---|
| AnchorName | Add Rows/Columns to Spreadsheet |
|---|
|
|
Interestingly, of the 23 genes of the
Down_Syndrome_vs_Normal (A) spreadsheet, 20 genes are located on chromosome 21. This suggests that the gene expression changes associated with Down syndrome observed in this study are primarily located on chromosome 21,
not distributed throughout the genome, an important finding of this study.
...