Hierarchical Clustering
The gene list in spreadsheet Down_Syndrome_vs_Normal (A) can be used for hierarchical clustering to visualize patterns in the data.
- Under the Visualization section in the Gene Expression workflow, select Cluster Based on Significant Genes (Figure 1)
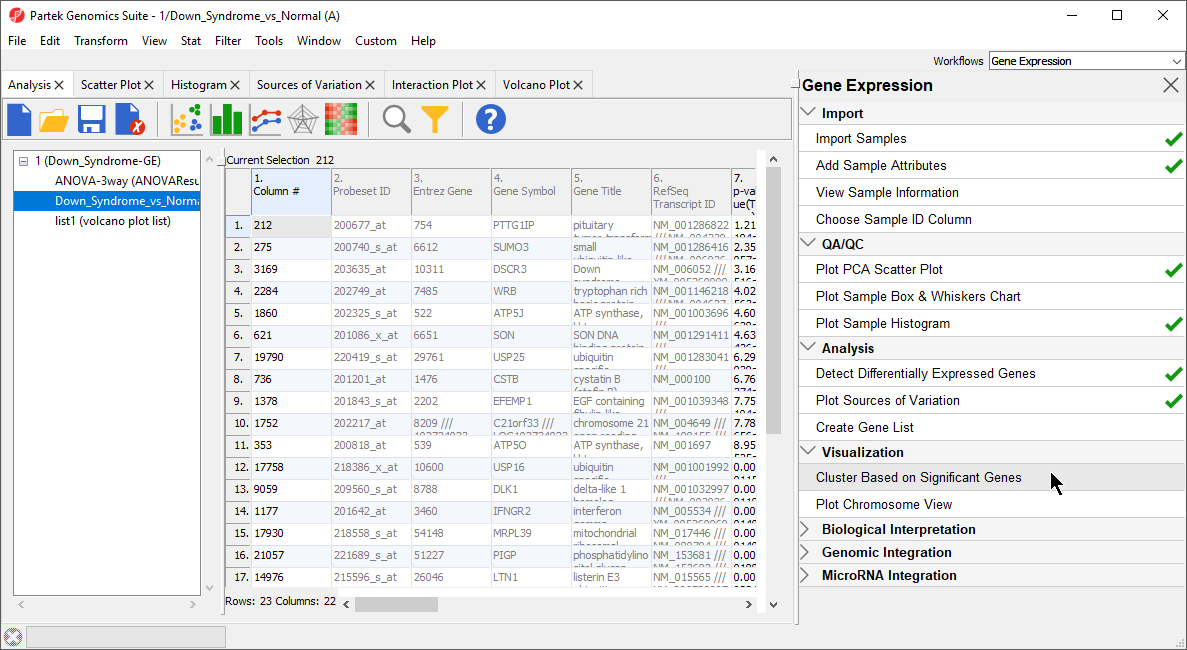 Figure 1. Select cluster based on significant genes from the Visualization panel of the Gene Expression workflow
- The Cluster Significant Genes dialog asks you to specify the type of clustering you want to perform. Select Hierarchical Clustering and select OK
- Choose the Down_Syndrome_vs_Normal (A) spreadsheet under the Spreadsheet with differentially expressed genes
- Choose the Standardize – shift genes to mean of zero and scale to standard deviation of one under the Expression normalization panel. This option will adjust all the gene intensities such that the mean is zero and the standard deviation is 1
- Select OK to generate a Hierarchical Clustering tab (Figure 2)
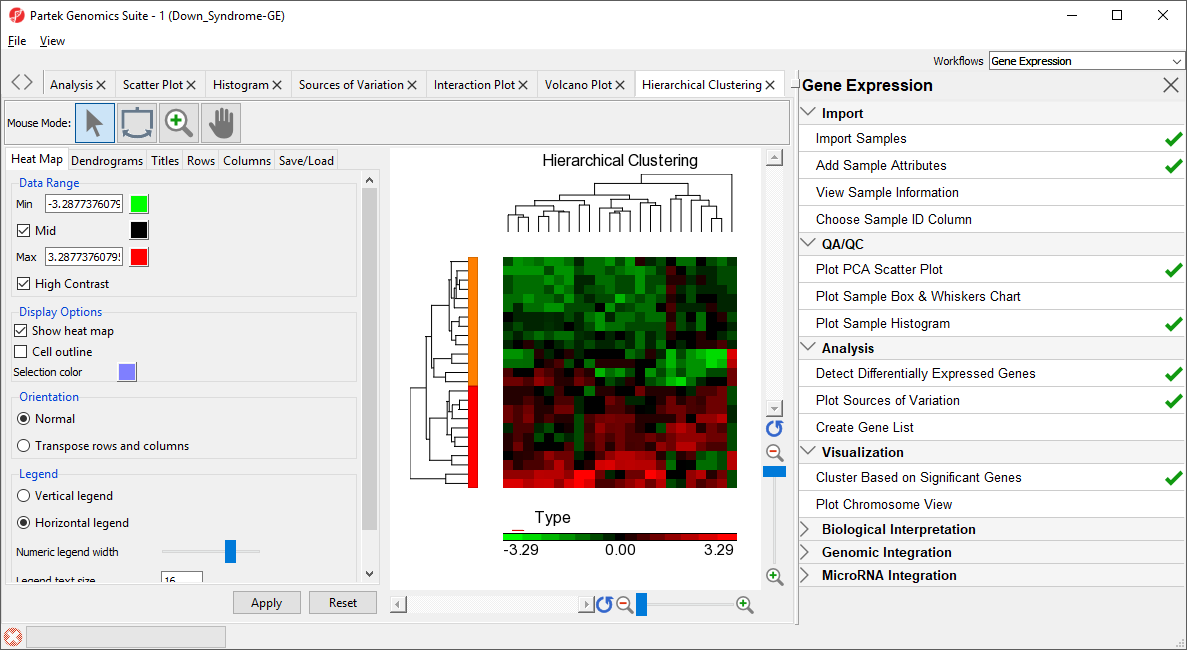 Figure 2. Hierarchical Clustering of Down_Syndrome_vs_Normal (A)
The graph (Figure 2) illustrates the standardized gene expression level of each gene in each sample. Each gene is represented in one column, and each sample is represented in one row. Genes with no difference in expression have a value of zero and are colored black. Genes with increased expression in Down syndrome samples have positive values and are colored red. Genes with reduced expression in Down syndrome samples have negative values and are colored green. Down syndrome samples are colored red and normal samples are colored orange. On the left-hand side of the graph, we can see that the Down syndrome samples cluster together.
Figure 2. Hierarchical Clustering of Down_Syndrome_vs_Normal (A)
The graph (Figure 2) illustrates the standardized gene expression level of each gene in each sample. Each gene is represented in one column, and each sample is represented in one row. Genes with no difference in expression have a value of zero and are colored black. Genes with increased expression in Down syndrome samples have positive values and are colored red. Genes with reduced expression in Down syndrome samples have negative values and are colored green. Down syndrome samples are colored red and normal samples are colored orange. On the left-hand side of the graph, we can see that the Down syndrome samples cluster together.
For more information on the methods used for clustering, you can refer to Chapter 8: Hierarchical & Partitioning Clustering in Help > User’s Manual. For a tutorial on configuring the clustering plot, please refer to the user guide.
Adding Gene Annotations
During data importation, the GeneChip annotation file was linked to the imported data. This linked annotation information can be added as new columns to the ANOVA or gene list spreadsheets. For example, we can add additional annotation to the gene list we created from the ANOVA results as follows:
- In the Down_Syndrome_vs_Normal (A) spreadsheet, right click on the second column header 2. ProbesetID and select Insert Annotation from the pop-up menu (Figure 3)
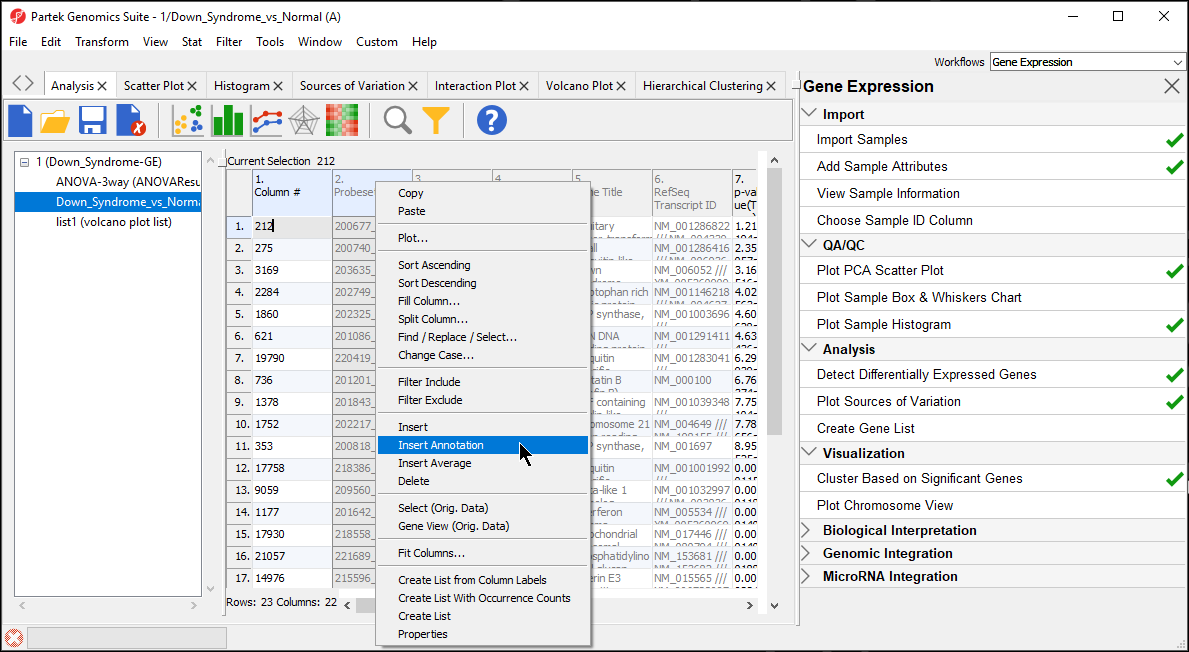 Figure 3. Inserting an annotation
- Select Chromosomal Location under the Column Configuration panel (Figure 4). Leave everything else as default and select OK
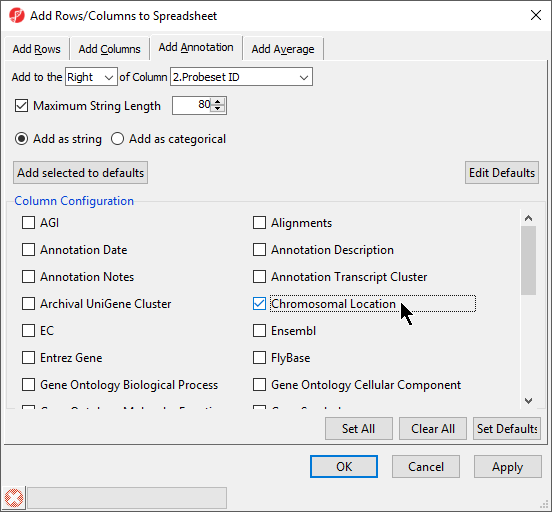 Figure 4. Adding Chromosomal Location annotation
Interestingly, of the 23 genes of the Down_Syndrome_vs_Normal (A) spreadsheet, 20 genes are located on chromosome 21. This suggests that the gene expression changes associated with Down syndrome observed in this study are primarily located on chromosome 21, not distributed throughout the genome, an important finding of this study.
Figure 4. Adding Chromosomal Location annotation
Interestingly, of the 23 genes of the Down_Syndrome_vs_Normal (A) spreadsheet, 20 genes are located on chromosome 21. This suggests that the gene expression changes associated with Down syndrome observed in this study are primarily located on chromosome 21, not distributed throughout the genome, an important finding of this study.
To save changes to the spreadsheet, select the Save Active Spreadsheet icon (![]() ).
).
Additional Assistance
If you need additional assistance, please visit our support page to submit a help ticket or find phone numbers for regional support.


| Your Rating: |
|
Results: |

|
0 | rates |
Overview
Content Tools