Page History
...
To enable filtering right-click on the header of the CHR column > Properties and set the type to categorical (and OK). Now, activate the Interactive Filter tool (![]() ) . If needed use the drop-down list to point to the CHR column. The column chart represents the number of appearances of each chromosome in the spreadsheet (i.e. the number of probes per chromosome). To remove the probes on the X and the Y chromosome left click on the two right-most columns (the pop up balloon will show you the chromosome label) and the columns will be grayed out (Figure 7).
) . If needed use the drop-down list to point to the CHR column. The column chart represents the number of appearances of each chromosome in the spreadsheet (i.e. the number of probes per chromosome). To remove the probes on the X and the Y chromosome left click on the two right-most columns (the pop up balloon will show you the chromosome label) and the columns will be grayed out (Figure 7).
| Numbered figure captions | ||||
|---|---|---|---|---|
| ||||
|

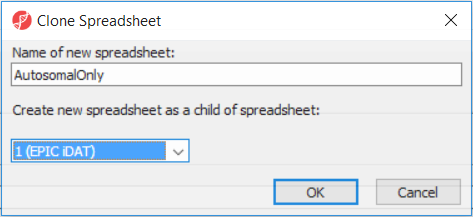
After removal of the probes on the sex chromosomes, let us extract all the autosomal probes to a new spreadsheet. Right click on the ANOVA 1-way spreadsheet > Clone... Set the Name of new spreadsheet to AutosomalOnly and make it a child of the top-level spreadsheet (EPIC iDAT) (Figure 8). Push OK. The newly created autosomalonly spreadsheet will be a new starting point for all the downstream steps.
| Numbered figure captions | ||||
|---|---|---|---|---|
| ||||
|
Section Heading
Section headings should use level 2 heading, while the content of the section should use paragraph (which is the default). You can choose the style in the first dropdown in toolbar.
...
Overview
Content Tools