Page History
...
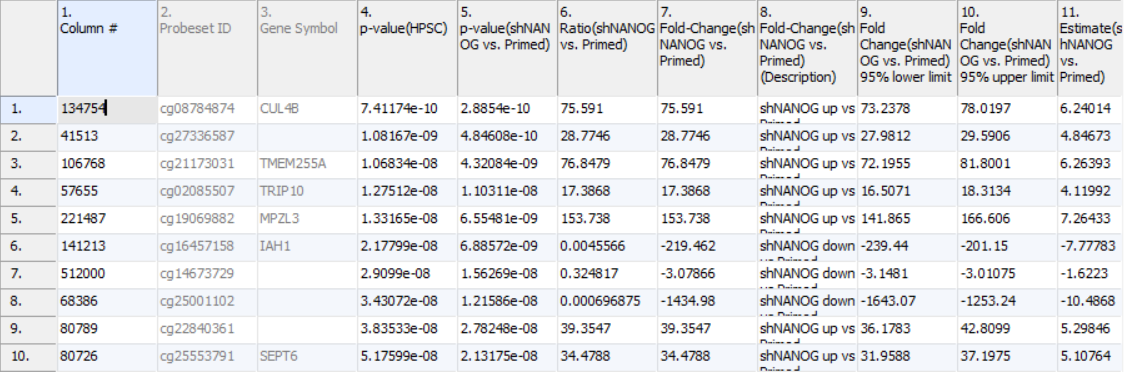
4. p-value(HPSC): overall p-value for the specified factor (in parenthesis). A low p-value indicates that there is a difference in methylation between the levels of this attribute (i.e. study groups). The contrast p-values should then be used to evaluate individual group comparisons. If more than one factor is included in the model, p-value will be reported for each.
Next, for each contrast included in the model, a block of seven columns will be added, as follows:
5. p-value(shNANOG vs. Primed): p-value for the given contrast (in parenthesis). A low p-value indicates a difference in methylation between the groups included in the contrast (here: shNANOG and Primed).
6. Ratio(shNANOG vs. Primed): ratio of average methylation level in one over the other
| Numbered figure captions | ||||
|---|---|---|---|---|
| ||||
|
...
Overview
Content Tools