Page History
...
| Numbered figure captions | ||||
|---|---|---|---|---|
| ||||
|
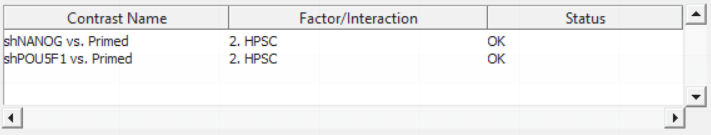
Push OK to confirm the contrast (and close the contrast dialog) and again to start the ANOVA calculation.
...
| Numbered figure captions | ||||
|---|---|---|---|---|
| ||||
|
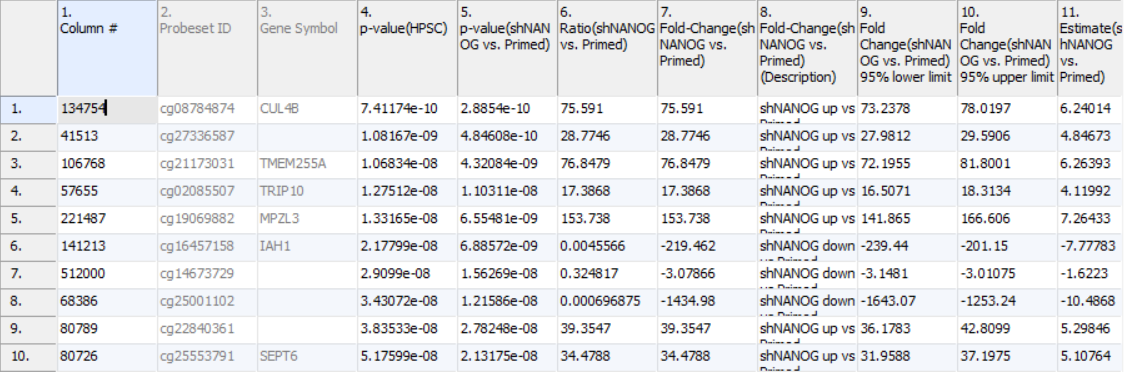
The result of 1-way ANOVA is shown in Figure 5. Each row of the table represents a single CpG locus (identified by Probeset ID column). The remaining columns contain the following information:
3. Gene Symbol: the gene overlapping the probe as specified in the Illumina manifest file
4. p-value(HPSC): overall p-value for the specified factor (in parenthesis). A low p-value indicates that there is a difference in methylation between the levels of this attribute (i.e. study groups). The contrast p-values should then be used to evaluate individual group comparisons. If more than one factor is included in the model, p-value will be reported for each.
5.
| Numbered figure captions | ||||
|---|---|---|---|---|
| ||||
|
Section Heading
Section headings should use level 2 heading, while the content of the section should use paragraph (which is the default). You can choose the style in the first dropdown in toolbar.
...
Overview
Content Tools