Page History
- What is Cell Ranger?
- Cell ranger in Partek Flow
- Running Cell ranger in Flow
- Cell ranger task report in Flow
- References
What is Cell Ranger?
Cell Ranger is a set of analysis pipelines that process Chromium single-cell RNA-seq output to align reads, generate feature-barcode matrices and perform clustering and gene expression analysis for 10X Genomics Chromium Technology[1].
Cell ranger in Partek Flow
Cell Ranger v6.0.0[2] has been wrapped in Partek® Flow® as Cell ranger task. It does not comprehensively cover all of the options and analysis cases Cell Ranger can handle for now, but converts FASTQ files from cellranger mkfastq and performs alignment, filtering, barcode counting, UMI counting. The output gene expression count matrix in .h5 format (both raw and filtered available for users to download in the output page of task details) then becomes the starting point for downstream analysis for scRNA-seq in Flow.
Running Cell ranger in Flow
To run the Cell ranger task in Flow, select Unaligned reads datanode, then select Cell ranger in the 10x Genomics section (Figure 1).
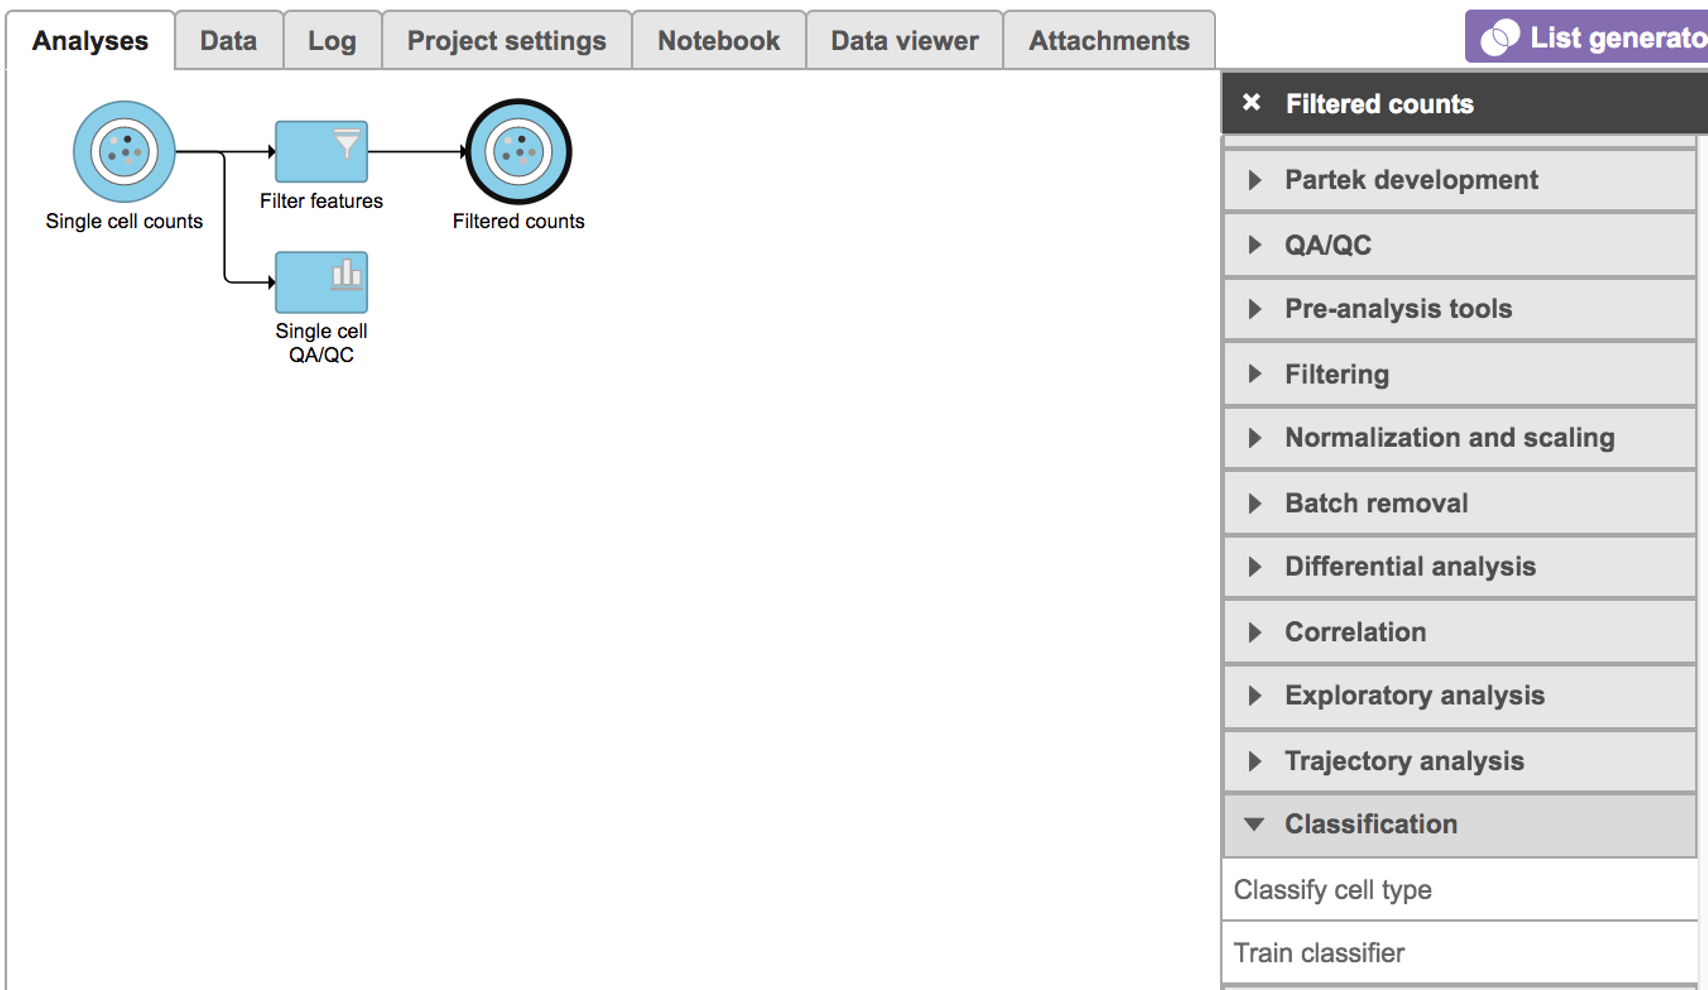
Figure 1. Selecting the Cell ranger task for converting fastqs to Single cell counts.
Users will be asked to create a Cell Ranger 6.0.0 reference genome if it is the first time to run the Cell ranger task in Flow (Figure 2).
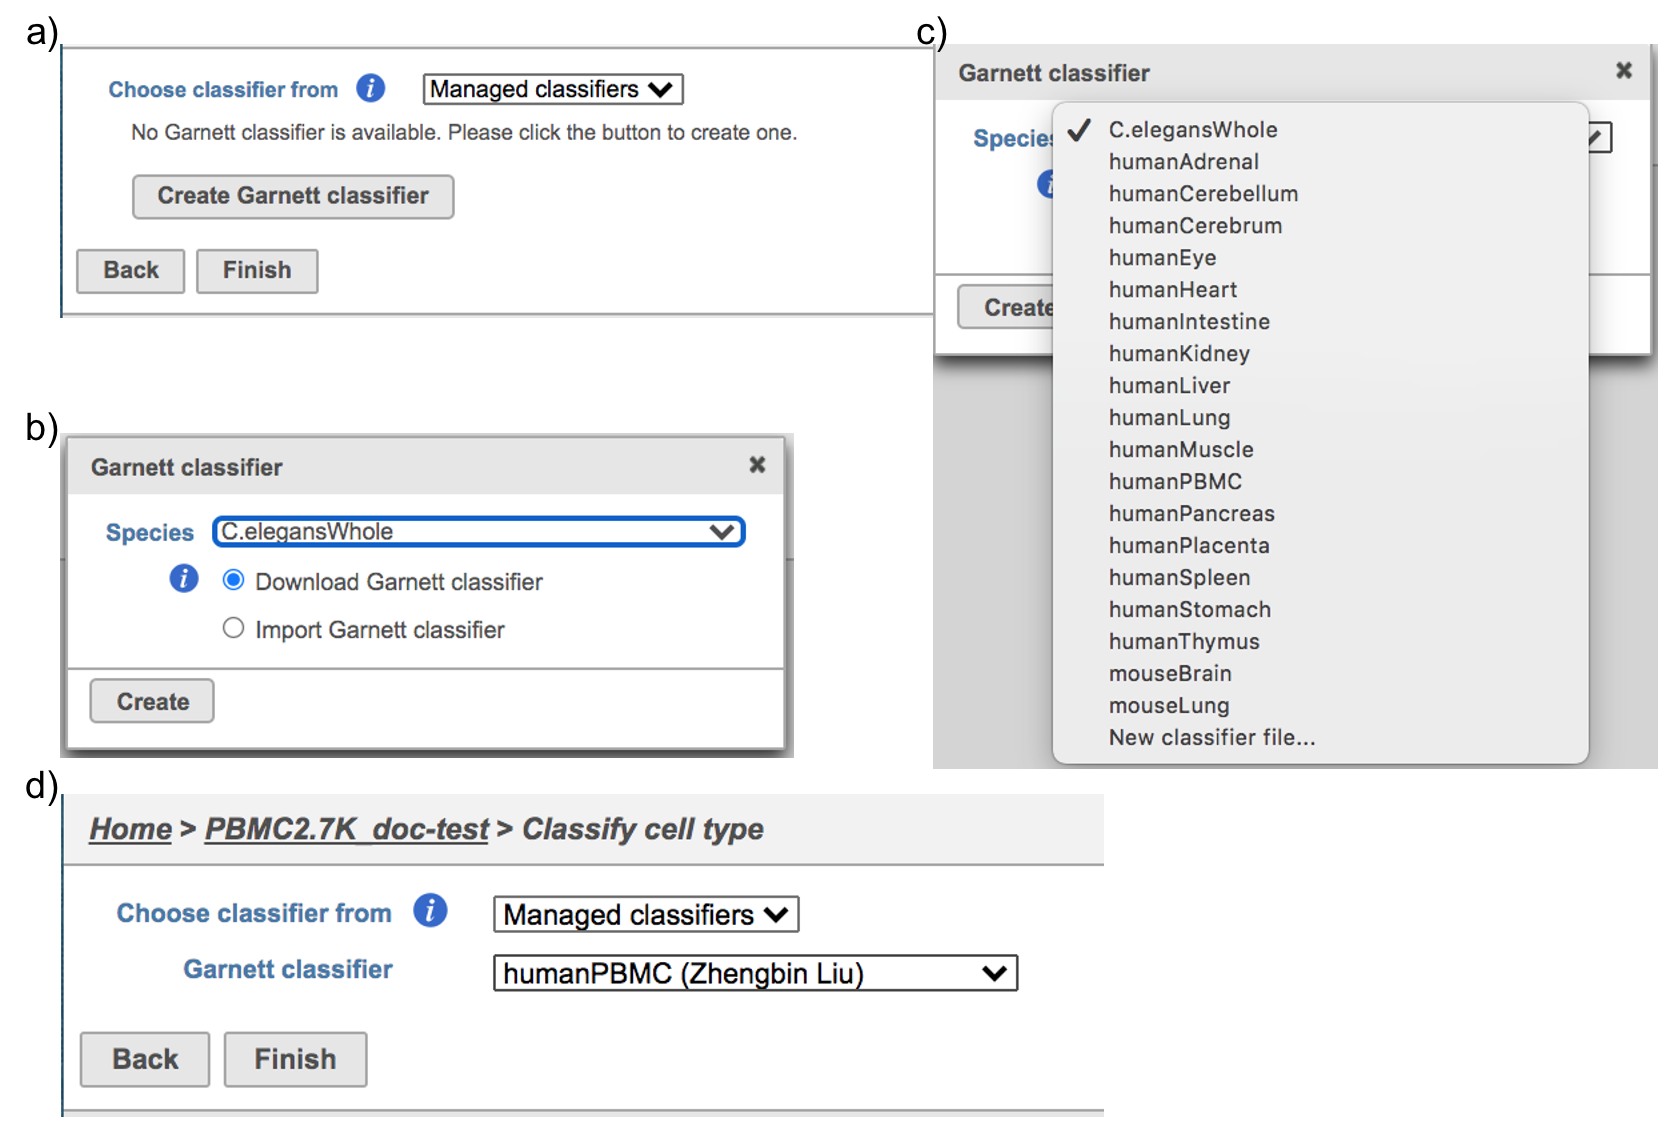
Figure 2. Create Cell Ranger 6.0.0 reference genome for the first time user.
Clicking the big grey button of Create Cell Ranger 6.0.0 reference would pop up a new window where lists the three pre-built reference genomes for human(hg38), mouse(mm10) and the mix of two(hg38-mm10), respectively (Figure 3). They are exactly the same reference genomes (2020-A) that are provided in Cell Ranger by default. In details, the transcriptome annotations are respectively GENCODE v32 for human and vM23 for mouse, which are equivalent to Ensembl 98[3]. References for other organisms currently are not available in Flow Cell ranger, and will be coming in the future.
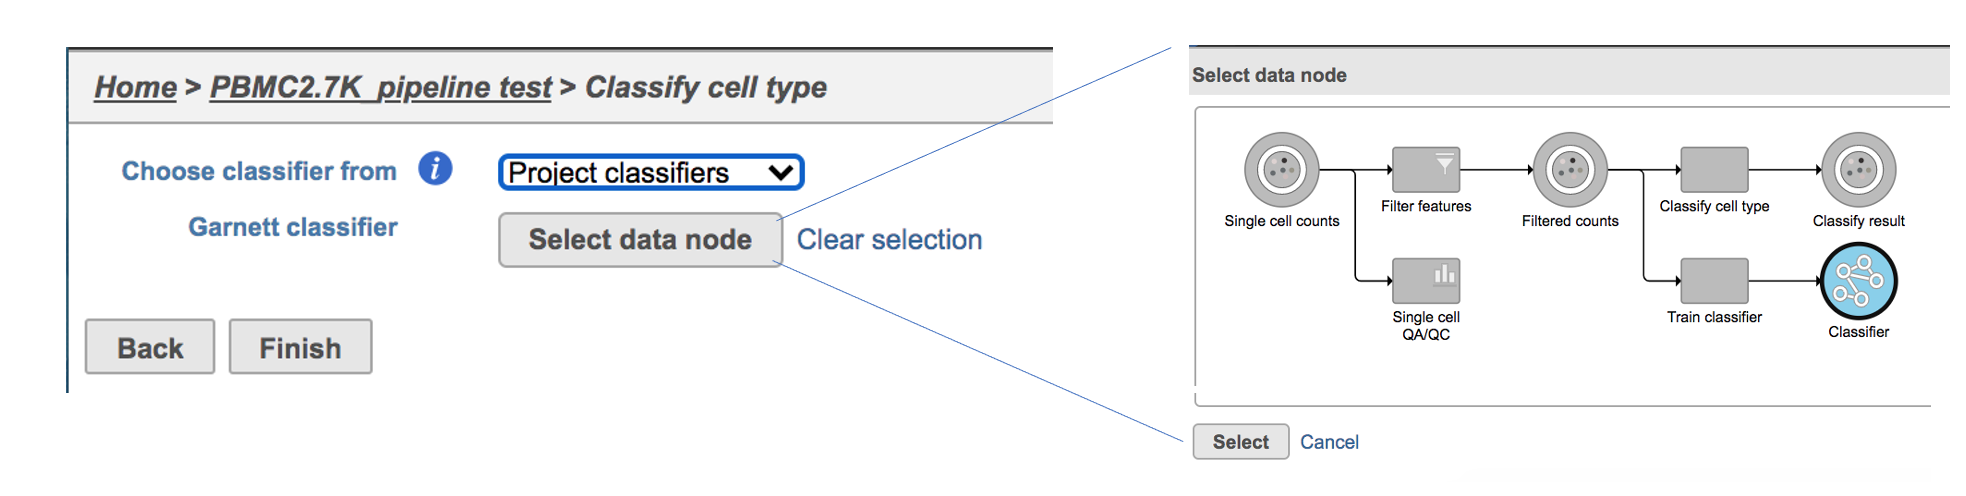
Figure 3. The available reference genomes in Flow Cell ranger.
Once the right reference has been chosen, simply press the Create button to finish. The reference of ‘hg38’ has been selected as an example here (Figure 4).
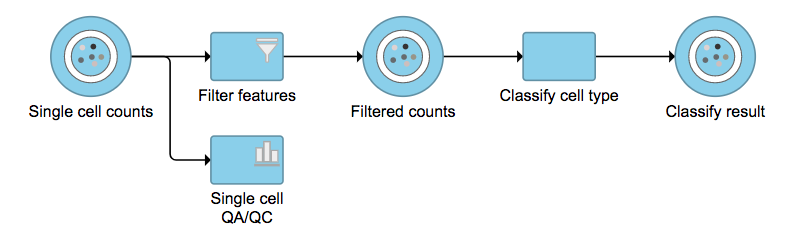
Figure 4. Create Human reference genome (hg38) for Cell ranger.
The main task menu will be refreshed as below (Figure 5) if references have been added. After the correct reference has been selected, users can go ahead click the Finish button to run the task as default.
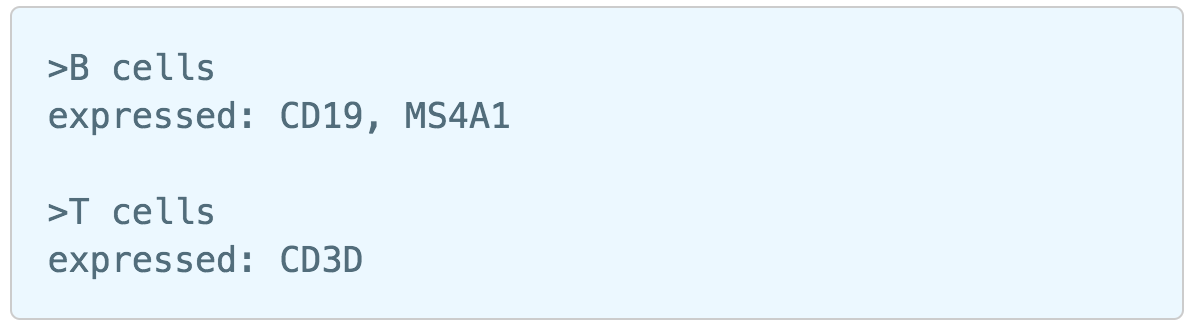
Figure 5. Run Cell ranger task with reference(hg38) in Flow.
A new data node named ‘Single cell counts’ will be displayed in Flow if the task is running (Figure 6). This data node contains filtered feature barcode count matrix. To open the task report when the task is finished, double click the output data node, or select the ‘Task report’ in the section after single clicking the data node. Users then will find the task report (Figure 7) is the same to the ‘Summary HTML’ from Cell Ranger output.
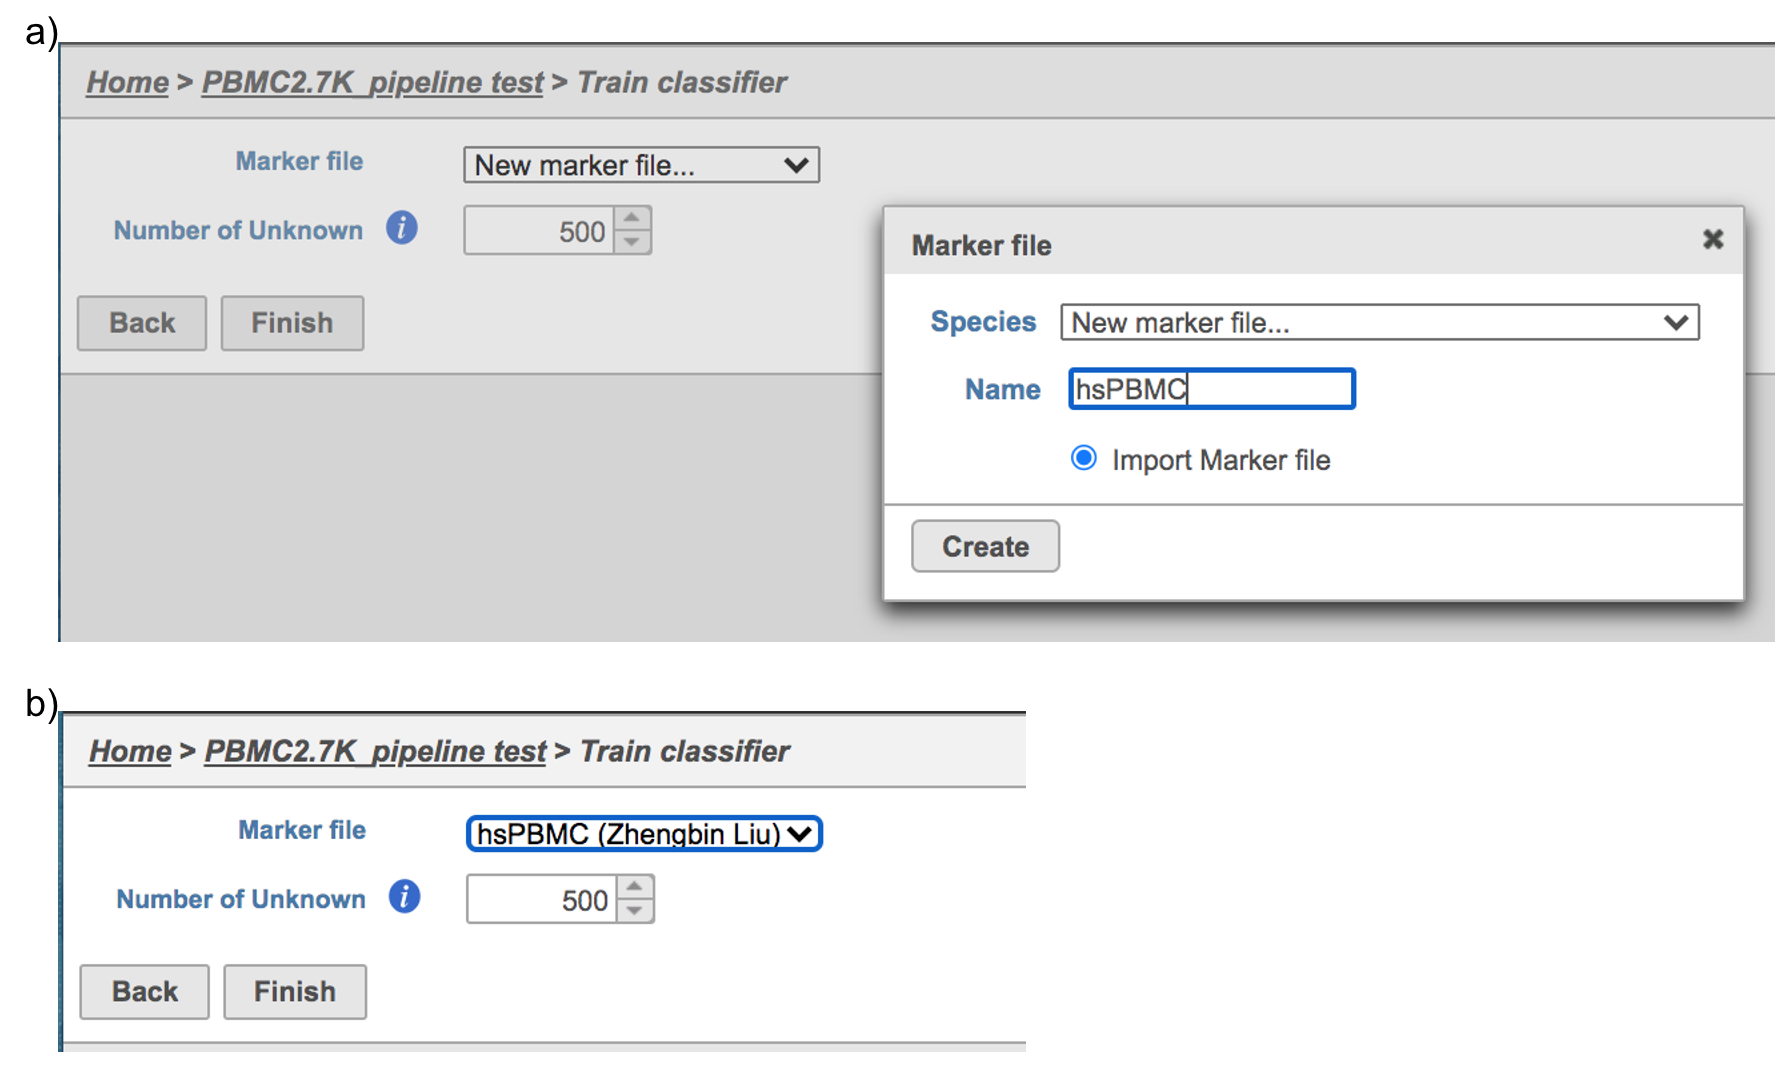
Figure 6. The running Cell ranger task in Flow.
Cell ranger task report in Flow
Task report is sample based. Users can use the dropdown list on the top left to switch samples. Under the sample name, there are two tabs on each report - Summary report and Analysis report (Figure 7). Important information on Estimated Number of Cells, Mean Reads per Cell, Median Genes per Cell, as well as information on Sequencing, Mapping, and Sample are summarized in different panels. The Barcode Rank Plot has also been included as an important piece in the Cells panel in the Summary report (Figure 7).

Figure 7. The example report of Cell ranger task in Flow.
Another two plots -biplots of Sequencing Saturation and Median Genes per Cell to Mean Reads per Cell have been included in the Analysis report as they are important metrics to library complexity and sequencing depth (Figure 8).

Figure 8. Analysis report of Cell ranger task in Flow.
Details will be exhibited and the panel will be expanded correspondingly if the the ![]() icon is clicked. In the example below, the plot of Median Genes per Cell has been expanded while the Sequencing Saturation plot hasn't (Figure 9).
icon is clicked. In the example below, the plot of Median Genes per Cell has been expanded while the Sequencing Saturation plot hasn't (Figure 9).

Figure 9. Expanded panel of Cell ranger task report in Flow.
Users can click Configure to change the default settings In Advanced options (Figure 5).
Expected cells: Expected number of recovered cells. Default: 3,000 cells.
Force cells: Force pipeline to use this number of cells, bypassing the cell detection algorithm. Use this if the number of cells estimated by Cell Ranger is not consistent with the barcode rank plot.
References
https://support.10xgenomics.com/single-cell-gene-expression/software/overview/welcome
https://support.10xgenomics.com/single-cell-gene-expression/software/pipelines/6.0/release-notes
- https://support.10xgenomics.com/single-cell-gene-expression/software/pipelines/4.0/release-notes
Additional Assistance
If you need additional assistance, please visit our support page to submit a help ticket or find phone numbers for regional support.
...
Table of Contents maxLevel 2 minLevel 2 exclude Additional Assistance
| maxLevel | 2 |
|---|---|
| minLevel | 2 |
| exclude | Additional Assistance |
Classification in Partek Flow can be performed manually or with automatic cell classification.
Manual classification in Partek Flow
For more help related to manual classification please see Classifying cells or watch this related help video: Manual classification. Partek flow provides hosted lists from the literature for many cell types which can be added using List management.
Automatic classification in Partek Flow
The Garnett1 automated cell type classification algorithm has been wrapped into Partek Flow as the Classification task. As with the original Garnett tool, Classification in Partek Flow works on single-cell data, along with a cell type definition (marker) file, and trains a regression-based classifier. Once a classifier is obtained and published, it can be applied to classify future datasets from similar tissues. To improve the user experience, both maker the marker file (.txt) and the classifier file (.rds) have been implemented as library files in Partek Flow.
Garnett classifiers in Partek Flow
Partek Flow hosts a few selection of pre-trained classifiers as Managed classifiers. The list of available classifiers can be found here[2]. If a managed classifier exists for your data type, we recommend that you try it. Besides In addition to the Managed classifiers, the Project classifiers trained on the same dataset prior to your classification can , may also be used to classify cell type. Project classifiers can be promoted to Managed classifiers if users publish them.
Classify cell type task in Partek Flow
To classify cell type using a pre-trained classifier:
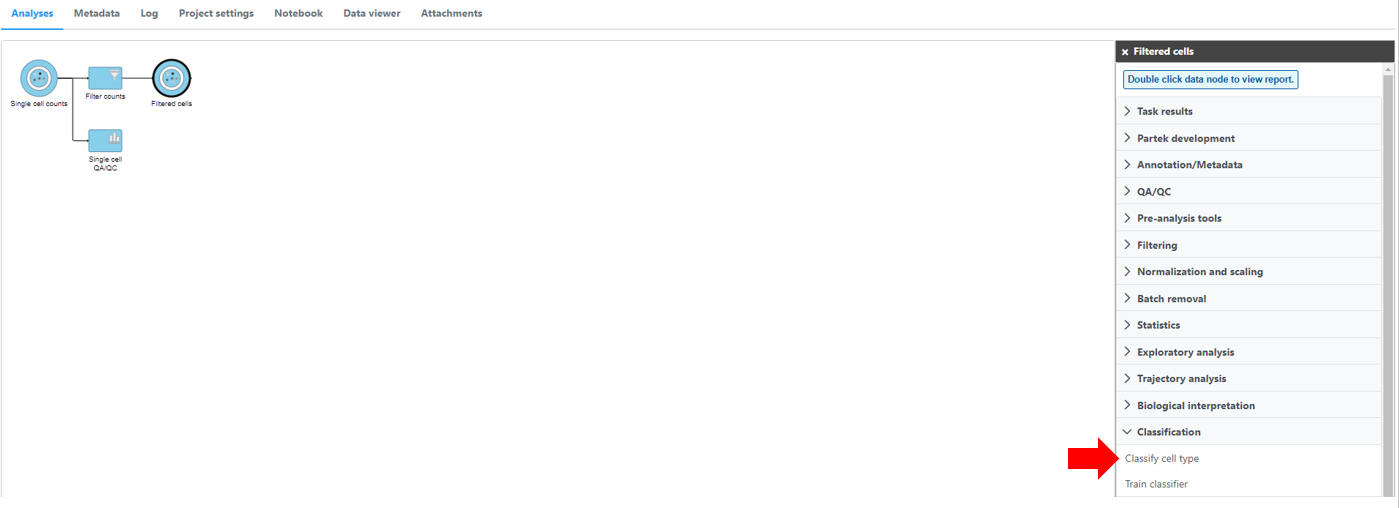
Select any non-normalized single cell data node, Filter counts here Choose . Filtered counts, which contains the raw count, is used here. Next, choose the Classify cell type task in the Classification section (Figure 1)
...
| Numbered figure captions | ||||
|---|---|---|---|---|
| ||||
|
If using the Managed classifiers users tool for the first time in Partek Flow, you will be asked to create a new classifier file if it is the first time to run the task in Flow (Figure 2a). Users could may select either the Download Garnett classifier that matches the species and tissue type with the their dataset working on from a Partek Flow maintaining maintained list or the Import Garnett classifier that’s that is trained out of Partek Flow (Figure 2b). Then Next, push the Create button to create the classifier file. Once the right correct classifier file has been created, Select select Finish to start running the task (Figure 2d).
...
| Numbered figure captions | ||||
|---|---|---|---|---|
| ||||
|
If users would like to classify cell type with the classifier obtained from the same project, ‘Project classifiers’ needs to be selected from the dropdown list. Next, use ‘Select data node’ to choose the classifier before clicking the Finish button (Figure 3).
| Numbered figure captions | ||||
|---|---|---|---|---|
| ||||
|
Regardless of which type of classifier was applied, Partek Flow will output a new data node named Classify result (Figure 4). These outputs of cell type annotation are exactly the same as Garnett1. "cell_type" is the cell type assignments directly from Garnett model. While "cluster_ext_type" is the cell type that's determined by expanding cell type assignments to nearby cells using Louvain clustering. Downstream analysis tasks such as normalization and PCA can be performed on the Classify result data node.
| Numbered figure captions | ||||
|---|---|---|---|---|
| ||||
|
Train classifier in Partek Flow
To train a classifier with a list of biomarkers with your own dataset:
Select any non-normalized single cell data node, Filtered counts is used here. Next, choose the Train classifier task in the Classification section (Figure 1)
Similar to previously described steps, first time users will be asked to create the Marker file. Partek Flow does not currently host any marker files, however, users may add them as library files. Marker files should be a .txt file with the marker information in correct format. The same example in the Garnett tutorial of a simple valid Marker file is provided here (Figure 5).
| Numbered figure captions | ||||
|---|---|---|---|---|
| ||||
|

Note:
1) Cell type name line starts with ">", followed by the name of the cell type, cell type name can NOT include hyphen (-).
2) Definition line starts with a keyword e.g. "expressed", "not expressed" eg. it is case sensitive. It followed by a ":" and space. Each gene name is followed by a comma and space, gene name is case sensitive. The line cannot be ended with comma or space.
For more details on how to construct a Marker file, please refer to Garnett tutorial3. Next, click the Create button and Partek Flow will then save the file with the name that users provide for future use (Figure 6a).
After the proper Marker file has been chosen, click the Finish button to start running the task as default (Figure 6b).
| Numbered figure captions | |||||||
|---|---|---|---|---|---|---|---|
| |||||||
|
Train classifier task report in Partek Flow
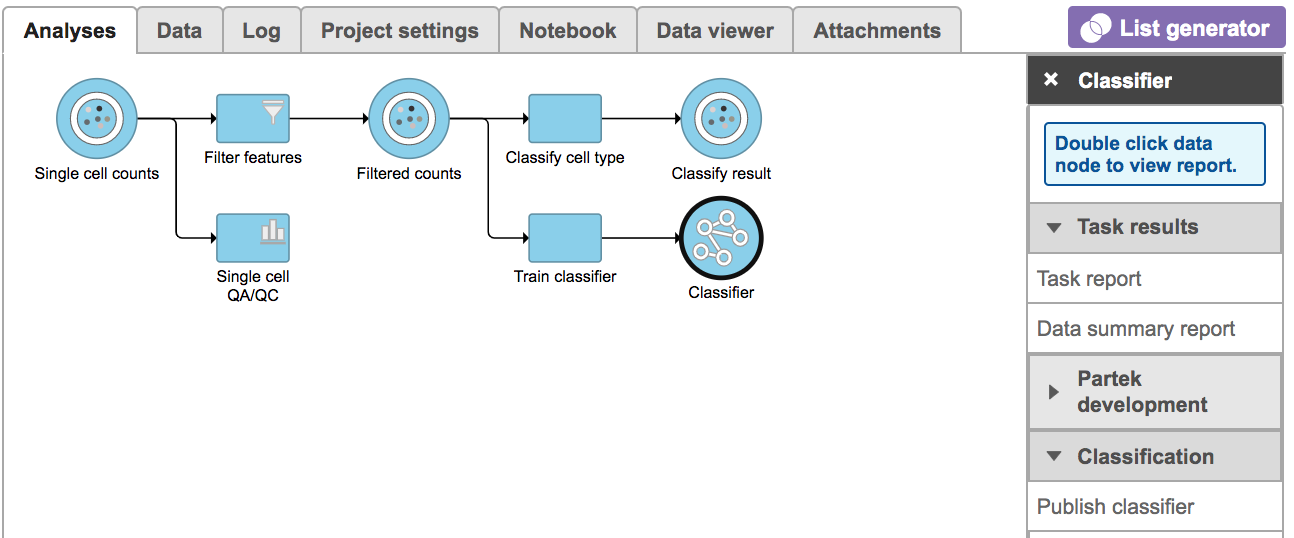
Once the task has finished, click the Classifier data node and choose the Task report in the Task results section, or prompt it to be one of the Managed classifiers by clicking the Publish classifier task in the Classification section (Figure 7).
| Numbered figure captions | ||||
|---|---|---|---|---|
| ||||
|
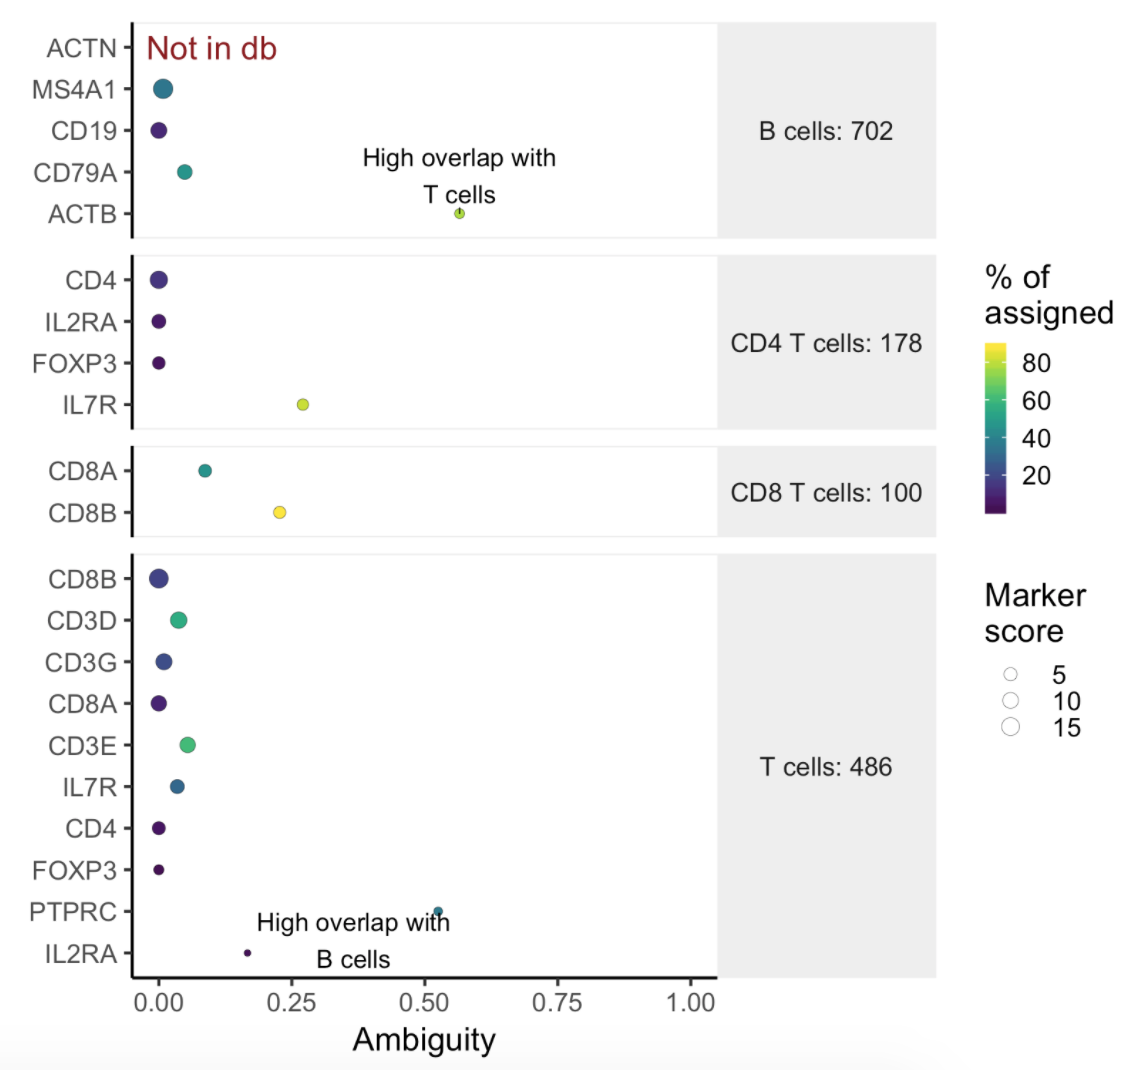
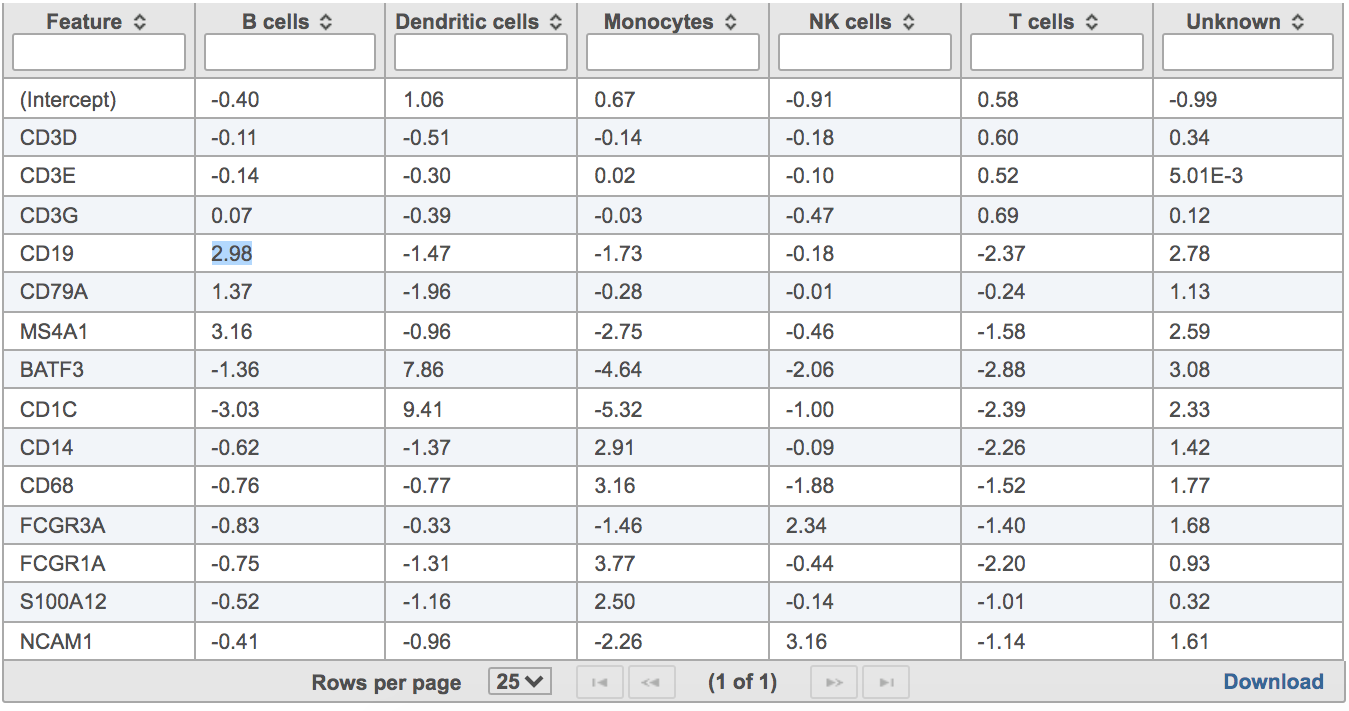
Users will find two parts in the task report: the marker evaluation plot (Figure 8) and the classification gene table (Figure 9). The marker evaluation plot provides some key information about whether the chosen markers are optimal. Ambiguity scores are calculated for each of the markers which indicates how many cells receive ambiguous labels when this marker is included. The classification gene table may give a hint to which genes are chosen as the relevant genes for distinguishing between different cell types.
| Numbered figure captions | ||||
|---|---|---|---|---|
| ||||
|
| Numbered figure captions | ||||
|---|---|---|---|---|
| ||||
|
Other adjustable parameters in this task include:
Number of Unknown: this tells Garnett how many outgroup cells it should compare against; the default is 500. For a dataset with fewer cells, the number should be smaller.
References
Additional Assistance
If you need additional assistance, please visit our support page to submit a help ticket or find phone numbers for regional support.
Overview
Content Tools