Page History
...
- Click Quantify to an annotation model (Partek E/M) (Figure 1)
| Numbered figure captions | ||||
|---|---|---|---|---|
|
...
|
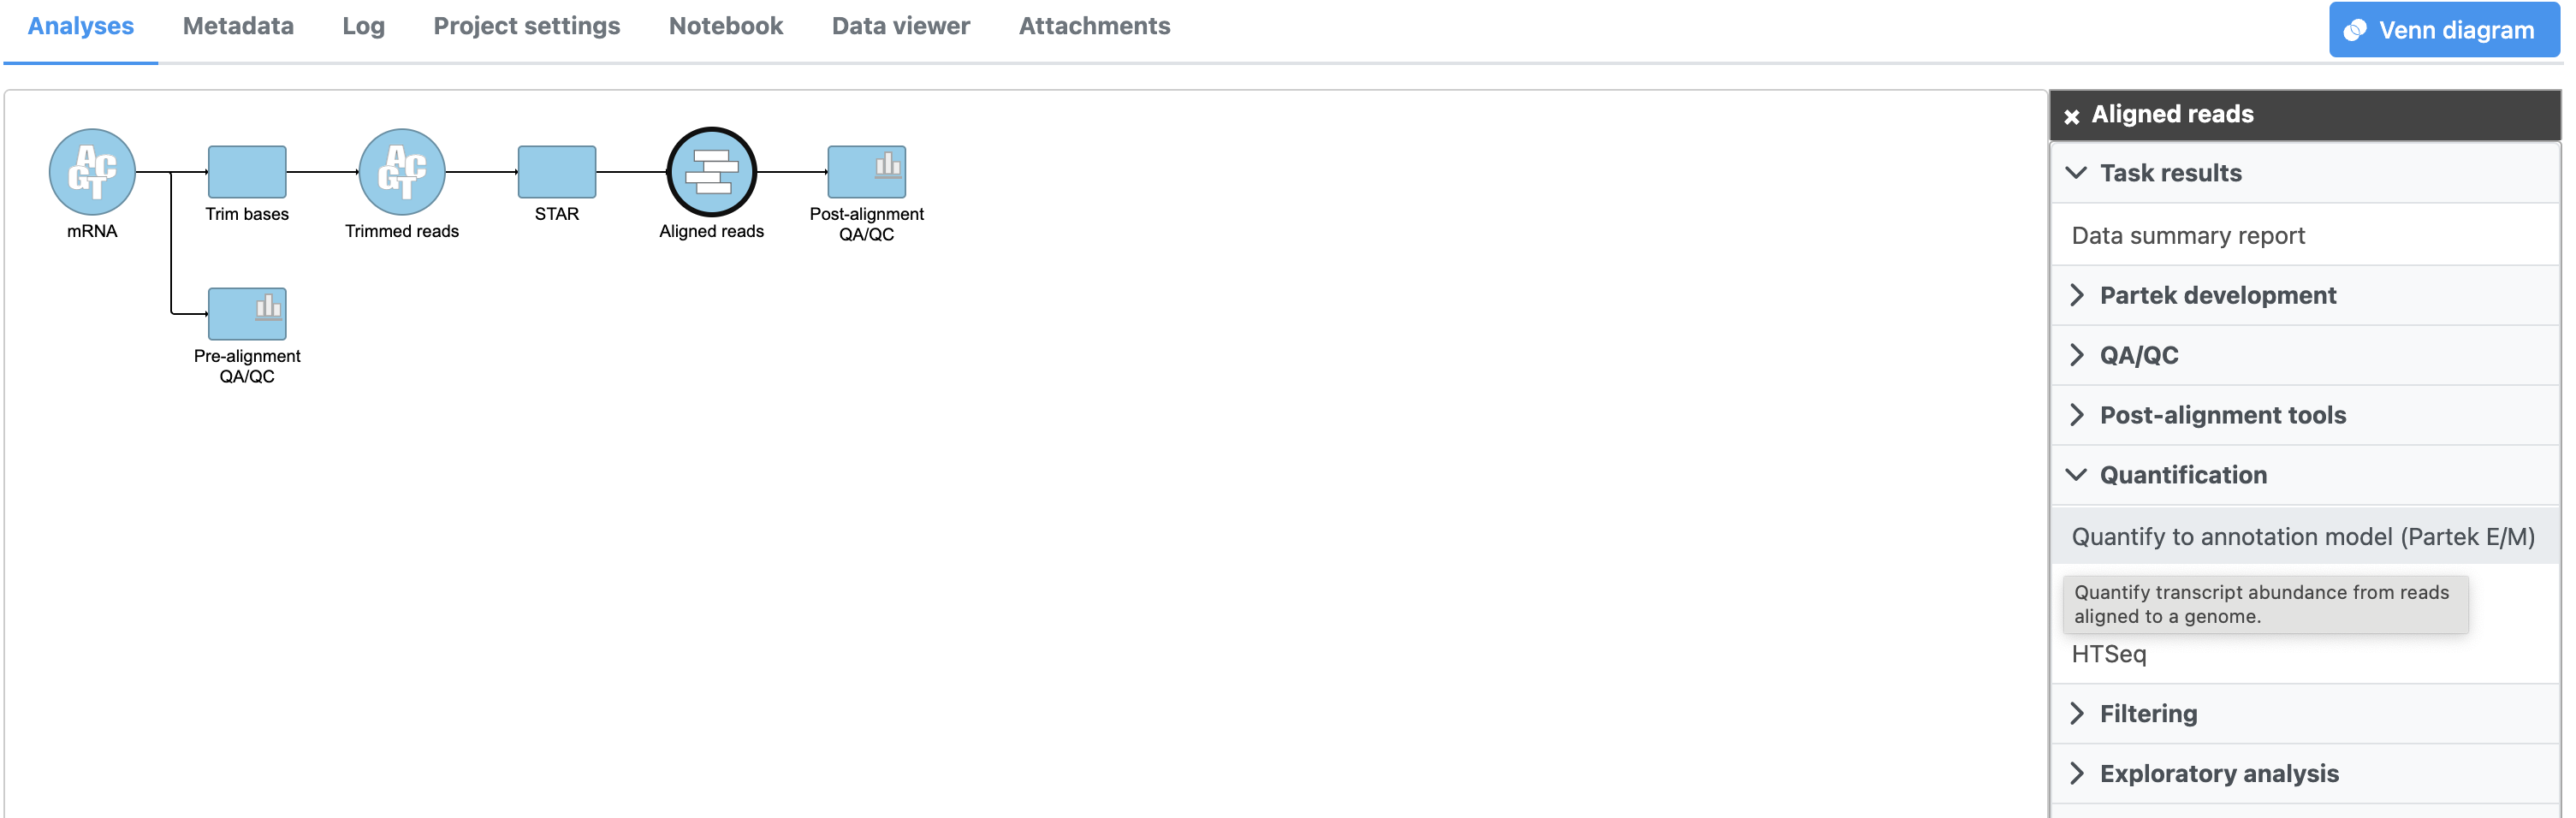
We will use the default options for quantification. To learn more about the different options, please see the Quantify to annotation model (Partek E/M) user guide or mouse over the  next to each option.
...
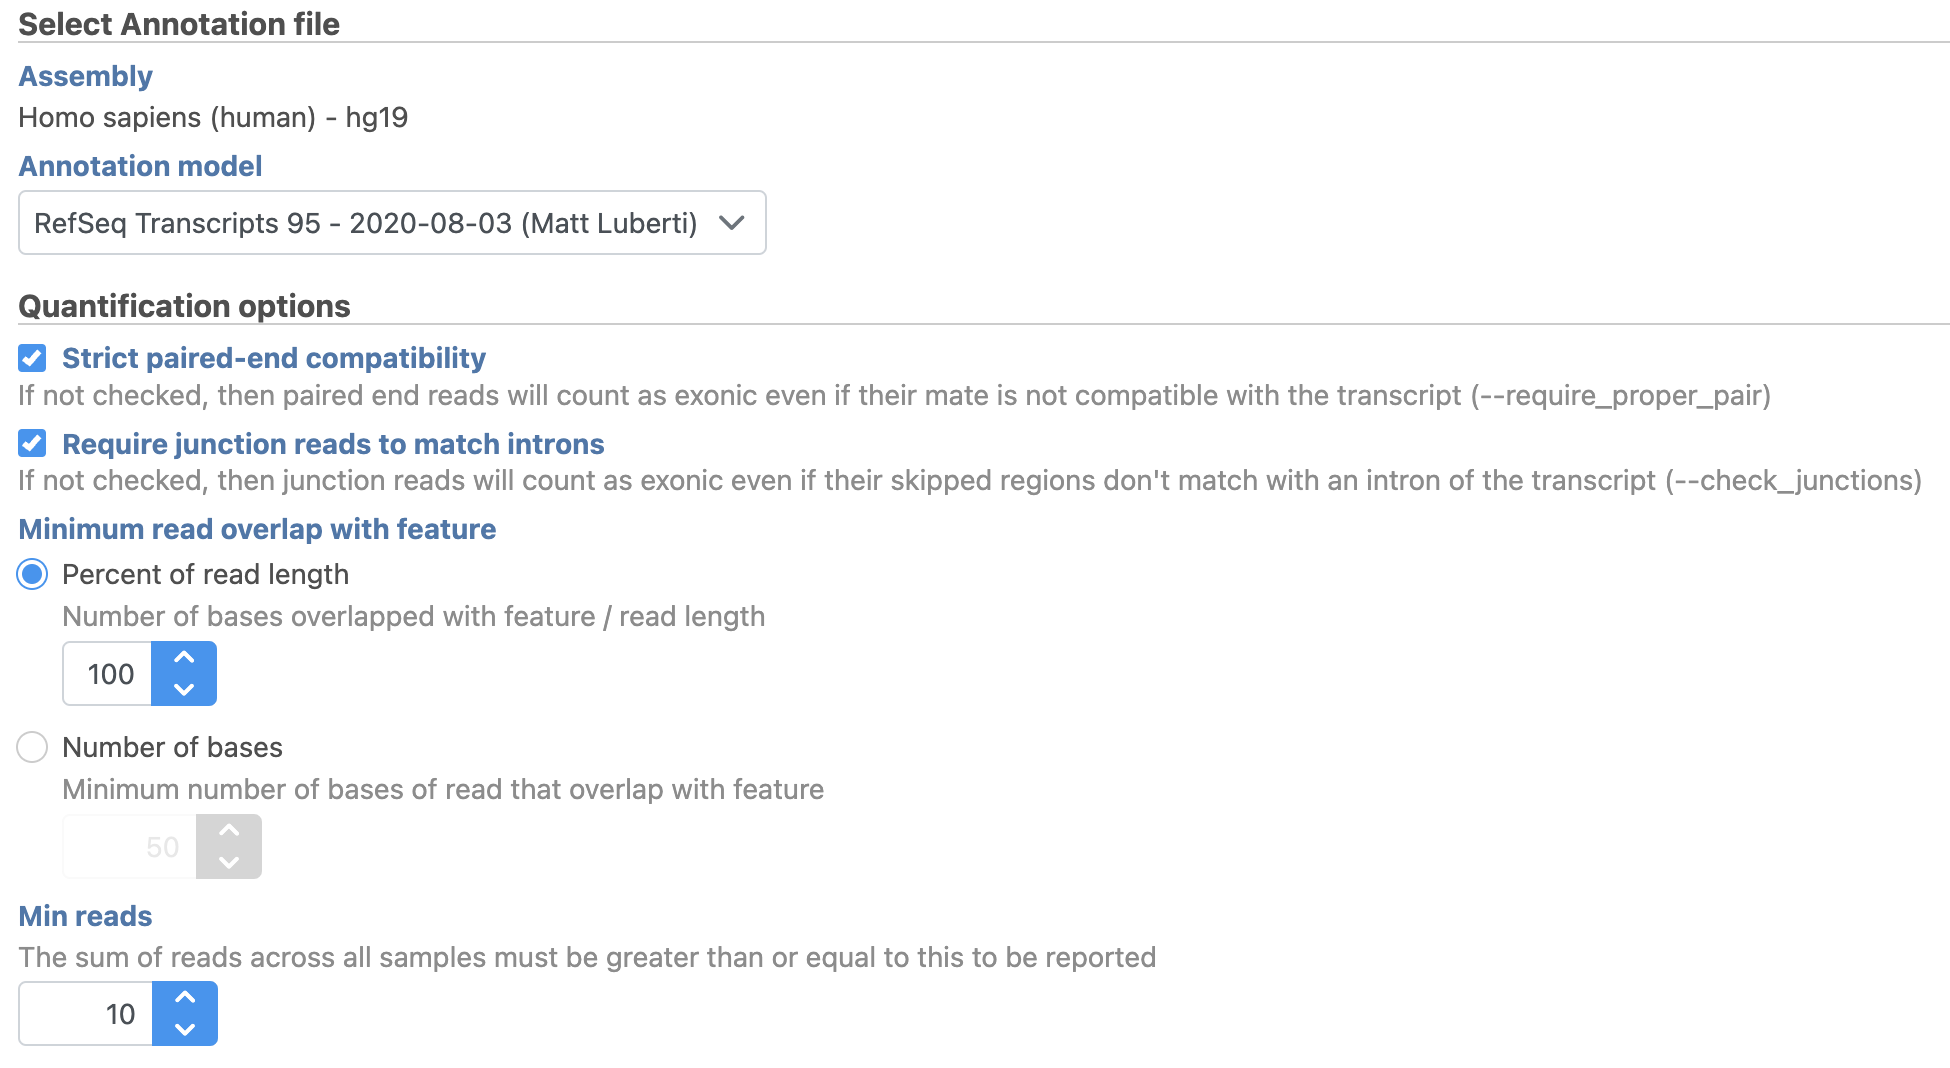
- Choose the latest RefSeq Transcripts 95 annotation from the Gene/feature annotation drop-down menu (you may need to download it first, via Library File Management)
- Click Finish (Figure 2)
| Numbered figure captions | ||||
|---|---|---|---|---|
| ||||
|

The Quantify to annotation model task node outputs two data nodes, Gene counts and Transcript counts (Figure 3).
| Numbered figure captions | ||||
|---|---|---|---|---|
| ||||
|

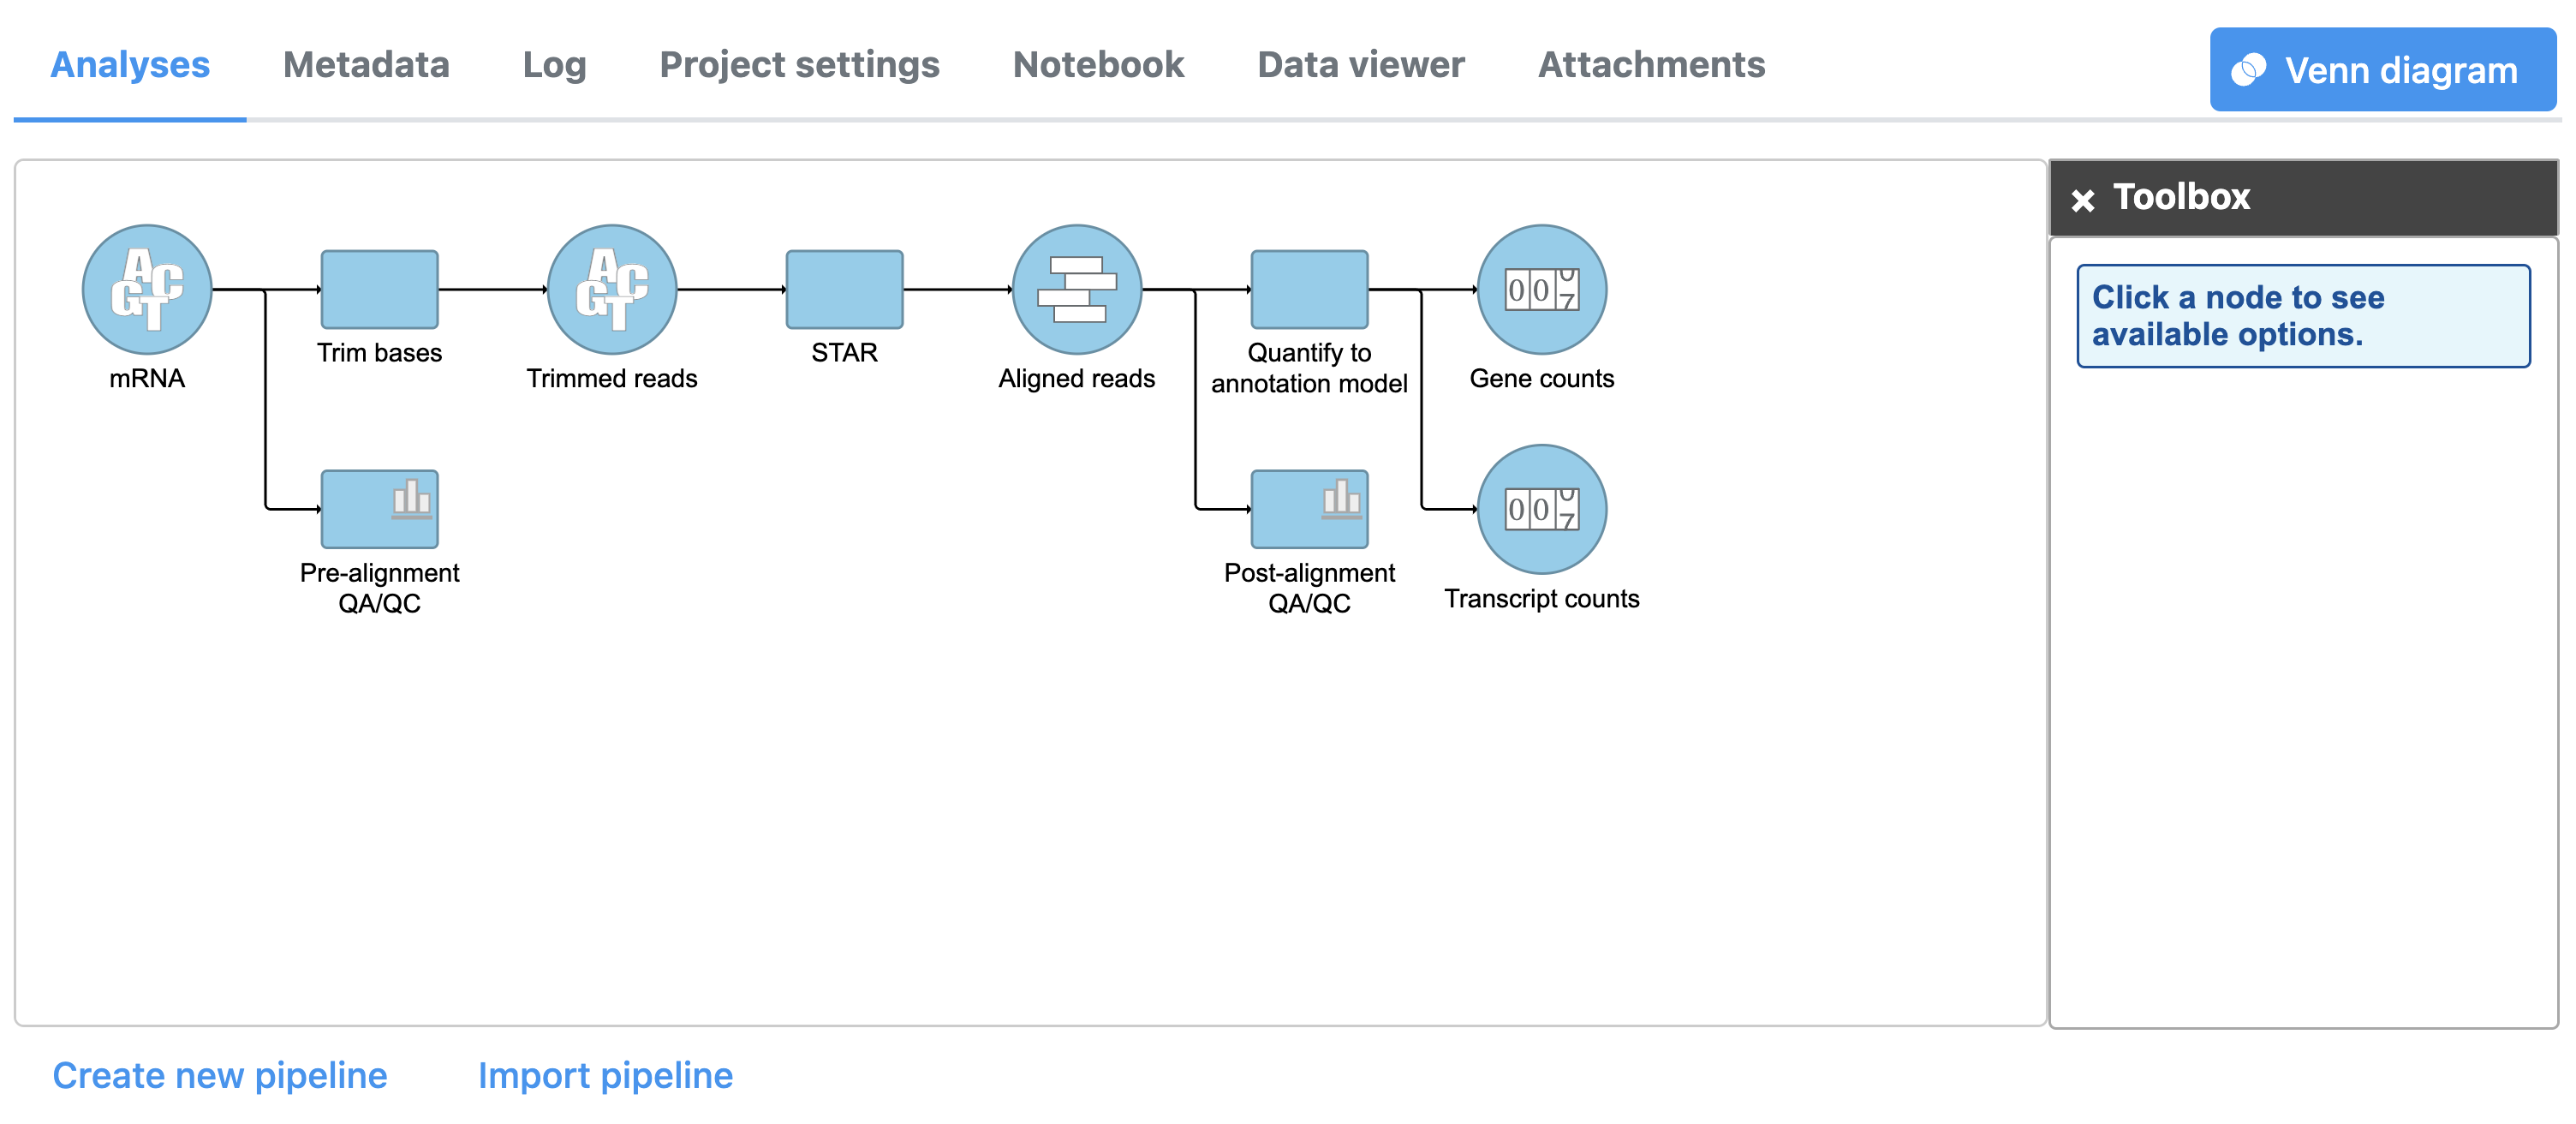
To view the results of quantification, we can select either data node output.
...
The task report details the number of reads within exons, introns, and intergenic regions. For detailed information about the quantification results, see the Quantify to annotation model (Partek E/M) user guide.
| Page Turner | ||
|---|---|---|
|
| Additional assistance |
|---|
| Rate Macro | ||
|---|---|---|
|
...
Overview
Content Tools