Page History
| Table of Contents |
|---|
In ChIP-seq or ATAC-seq analysis, a major challenge after detecting enriched regions or peaks is to compare samples and identify differentially enriched regions. In order to compare samples, a common set of regions must be identified and the number of reads mapping to each region must to quantified. The Quantify regions task addresses this challenge by generating a union set of unique regions and reporting the number of reads from each sample mapping to each region.
...
The Quantify regions task takes MACS2 results as output, a Peaks or Annotated Peaks data node, as its input. In a typical ATAC-Seq or ChIP-Seq analysis, MACS2 is configured to output a set of enriched regions or peaks for each experimental sample or group individually. Quantify regions takes these sets or of regions and identifies merges them into a union set of unique regions that it saves as a .bed file. Where from different To combine the region sets, overlapping regions between samples/groups are merged. Where overlap ends, it joins the break points of the regions . a break point is created and a new region defined. All non-overlapping or unique regions from each sample/group are also included.
For example, consider an experiment where MACS2 detected enriched regions for two samples, Sample A and Sample B. In Sample A, a region is detected on chromosome 1 from 100bp to 300bp, chr1:100-300. In Sample B, a region is detected at chr1:160-360. The Quantify regions task will give the following union set of unique regions for these partially overlapping regions:
chr1:100-160 (region detected in Sample A only)
...
The Quantify regions dialog includes configuration options for generating the union set of unique regions and quantify quantifying reads to the regions (Figure 1).
...
Quantify regions generates a Region counts data node with the number of counts of in each region for each sample. This data node can be annotated with gene information using the Annotate regions task and analyzed using tasks that take counts data as input, such as normalization, PCA, and differential ANOVA. For ChIP-Seq experiments with input control samples, the Normalize to baseline task can be used prior to downstream analysis.
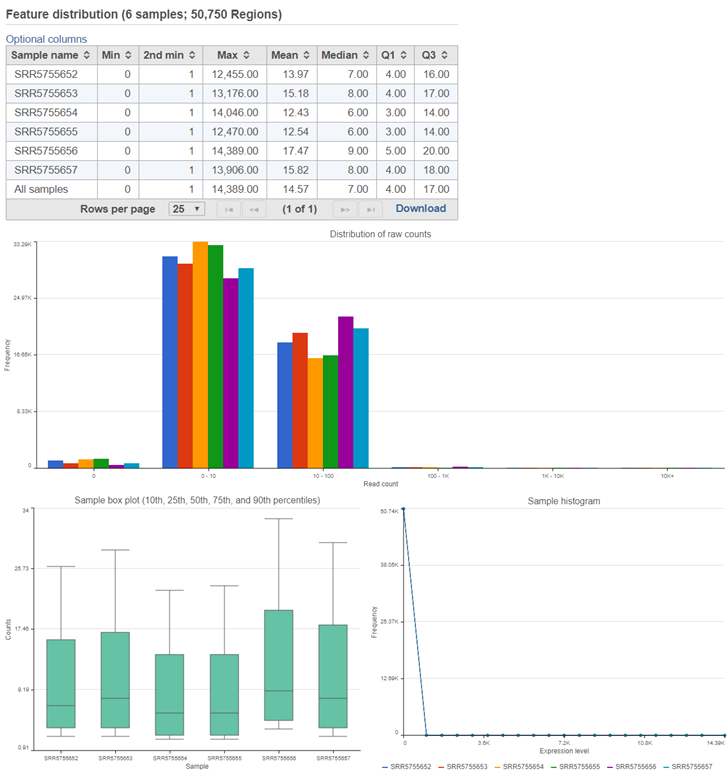
Similar to the Quantify to annotation model (Partek E/M) task report, the Quantify regions task report includes feature distribution information including a descriptive stats table, a distribution bar chart, a sample box plot, and sample histogram (Figure 32).
| Numbered figure captions | ||||
|---|---|---|---|---|
| ||||
|
...
Overview
Content Tools