Page History
| Table of Contents | ||||||
|---|---|---|---|---|---|---|
|
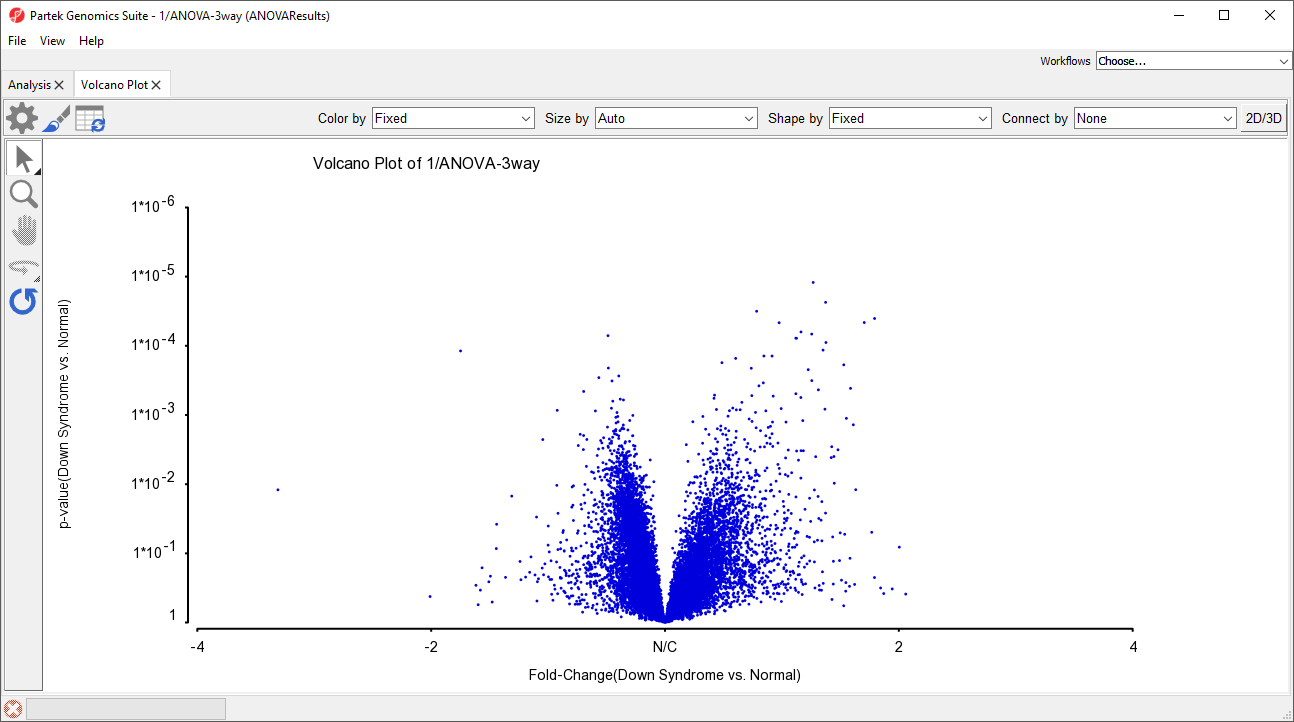
The volcano plot can be used to visualize displays p-values and fold-changes of numerous genomic features (e.g., genes or probe sets) at the same time. This allows differentially expressed genes to be quickly identified and saved as a gene list.
...
The volcano plot will open in a new tab (Figure 3). Control and color options for the volcano plot are largely similar to those described for Dot Plotfor a dot plot. On volcano plots with many probe(sets)/genes, the shapes and sizes of individual probe(sets)/genes will not be visible until they are selected.
| Numbered figure captions | ||||
|---|---|---|---|---|
| ||||
|
- Select (
 )
) - Select AxesSelect the Axes tab
- Select Set Cutoff Lines (Figure 4)
...
Overview
Content Tools