Page History
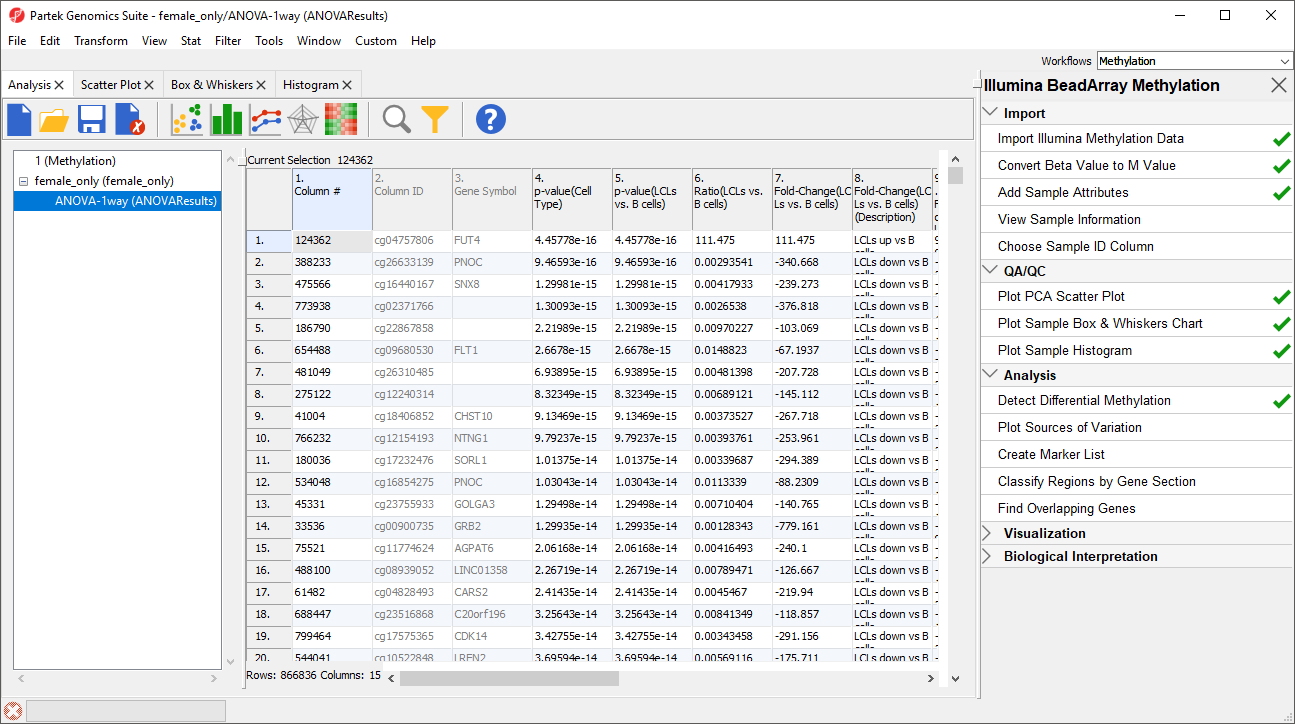
To detect differential methylation between CpG loci in different experimental groups, we can perform an ANOVA test. For this tutorial, we will perform a simple onetwo-way ANOVA to compare the methylation states of the four two experimental groups.
- Select Defect Detect Differential Methylation from the Analysis section of the Illumina BeadArray Methylation workflow
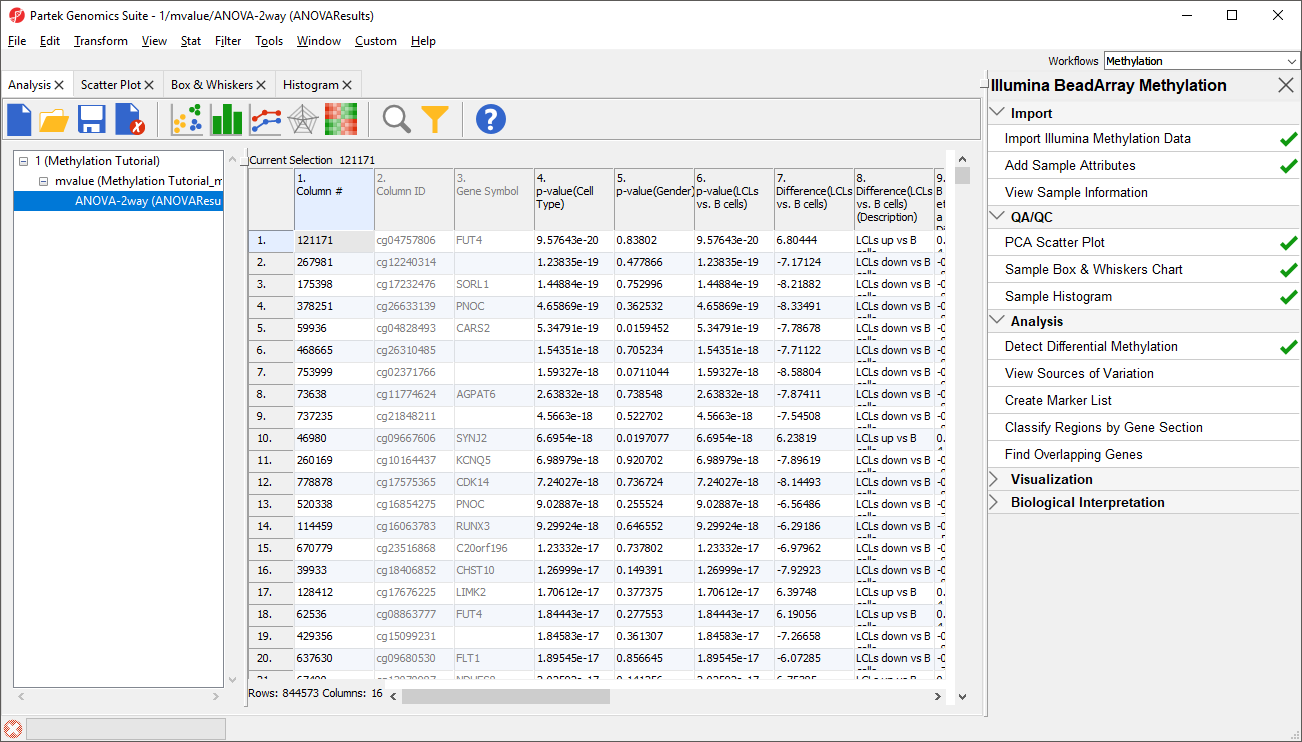
A new child spreadsheet, mvalue, is created when Detect Differential Methylation is selected. M-values are an alternative metric for measuring methylation. β-values can be easily converted to M-values using the following equation: M-value = log2( β / (1 - β)).
An M-value close to 0 for a CpG site indicates a similar intensity between the methylated and unmethylated probes, which means the CpG site is about half-methylated. Positive M-values mean that more molecules are methylated than unmethylated, while negative M-values mean that more molecules are unmethylated than methylated. As discussed by Du and colleagues, the β-value has a more intuitive biological interpretation, but the M-value is more statistically valid for the differential analysis of methylation levels.
Because we are performing differential methylation analysis, Partek Genomics Suite automatically creates an M-values spreadsheet to use for statistical analysis.
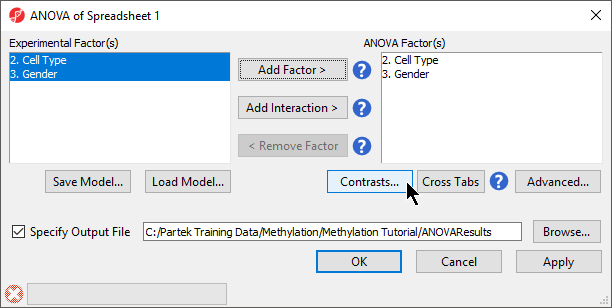
- Select 2. Cell Type and 3. Gender from the Experimental Factor(s) panel
- Select Add Factor > to move 2. Cell Type and 3. Gender to the ANOVA Factor(s) panel (Figure 1)
| Numbered figure captions | ||||
|---|---|---|---|---|
| ||||
|
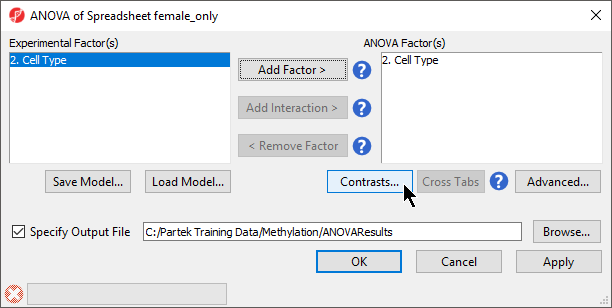
- Select Contrasts...
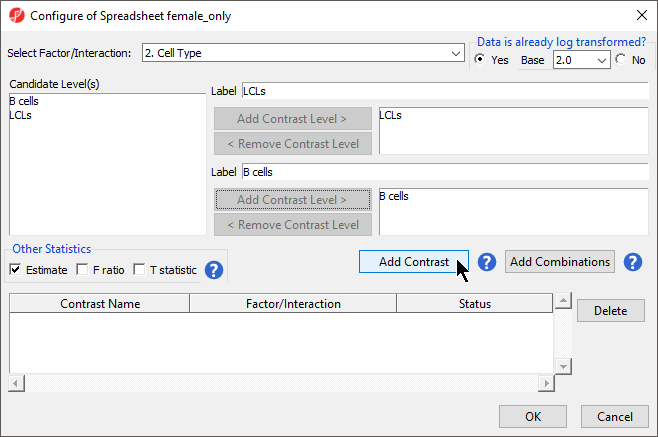
- Select Yes for Leave Data is already log transformed? because M-values are based on logit transformation
- Select LCLs
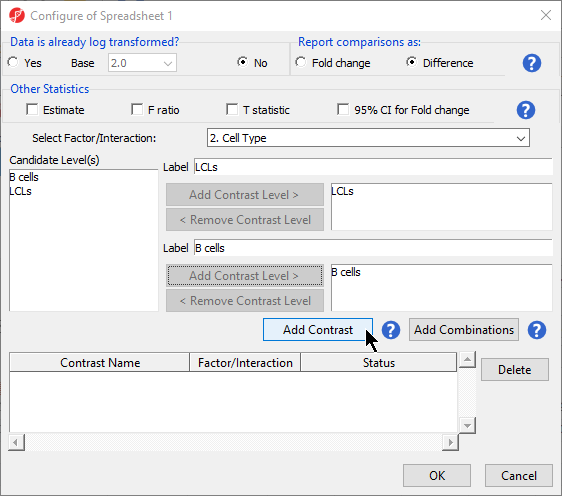
- Select set to No
- Leave Report comparisons as set to Difference
For methylation data, fold-change comparisons are not appropriate. Instead, comparisons should be reported as the difference between groups.
- Select 2. Cell Type from the Select Factor/Interaction drop-down menu
- Select LCLs
- Select Add Contrast Level > for the upper group
- Select B cells
- Select Add Contrast Level > for the lower group
- Select the Estimate box in the Other Statistics section of the Configure dialog Select Add Contrast (Figure 2)
- Select Add Contrast
By default, the fold-change value for each contrast will be calculated with the upper group as the numerator and the lower group as the denominator. Selecting Estimate will also include the difference in methylation levels between the groups at each CpG site in the output. These values will be needed later in the tutorial.
| Numbered figure captions | ||||
|---|---|---|---|---|
| ||||
|
- Select OK to close the Configuration dialog
...
| Numbered figure captions | ||||
|---|---|---|---|---|
| ||||
|
| Numbered figure captions | ||||
|---|---|---|---|---|
| ||||
|
|
| Page Turner | ||
|---|---|---|
|
...
Overview
Content Tools