Page History
...
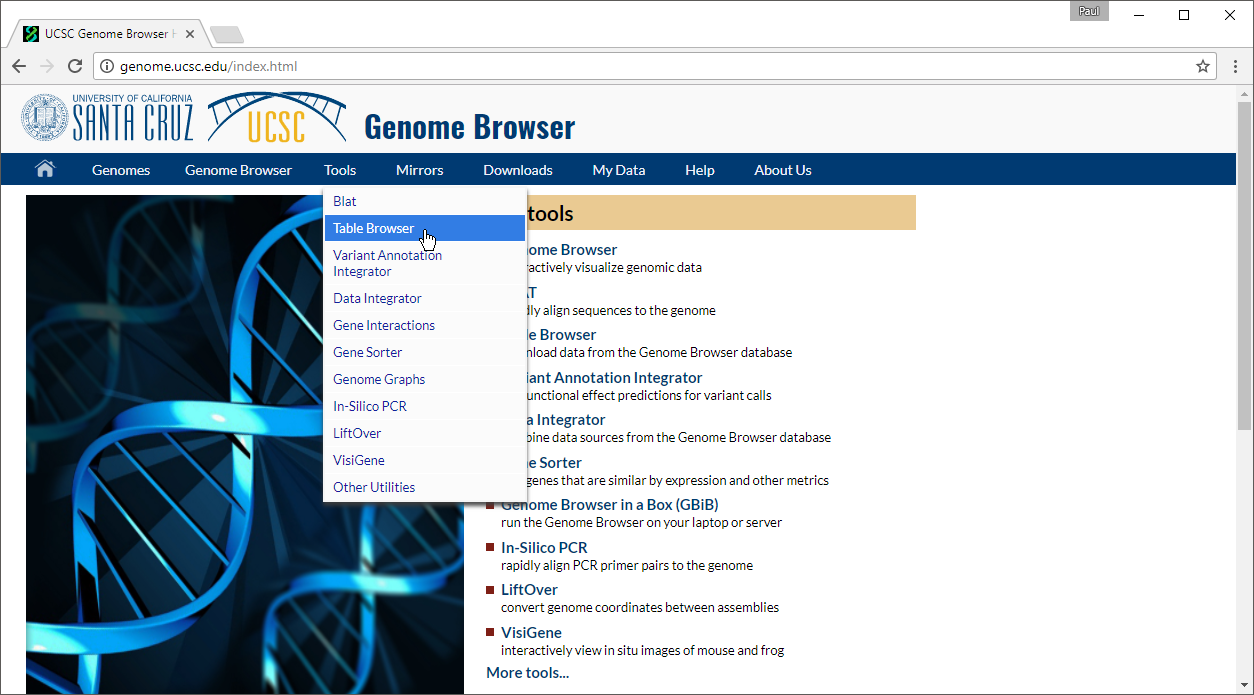
- Go to UCSC Genome Browser
- Select Table Browser under Tools in the main command bar of the webpage (Figure 1)
| Numbered figure captions | ||||
|---|---|---|---|---|
| ||||
|
- Configure the Table Browser page as shown (Figure 2)
| Numbered figure captions | ||||
|---|---|---|---|---|
| ||||
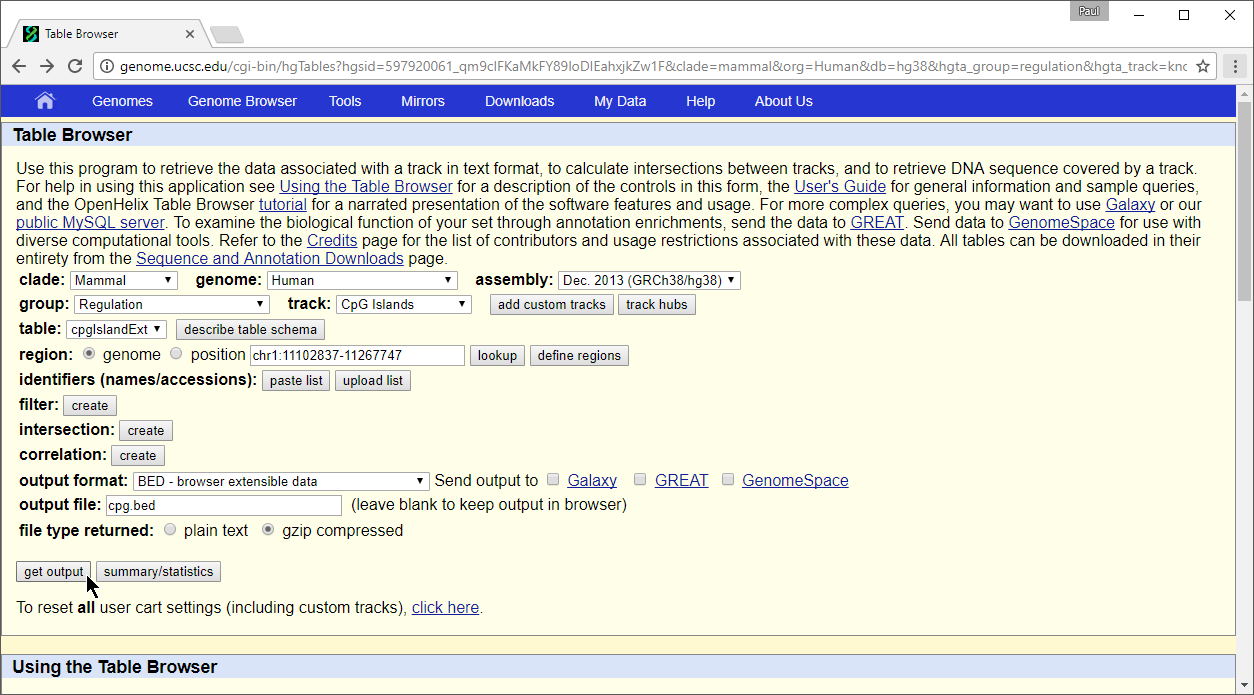 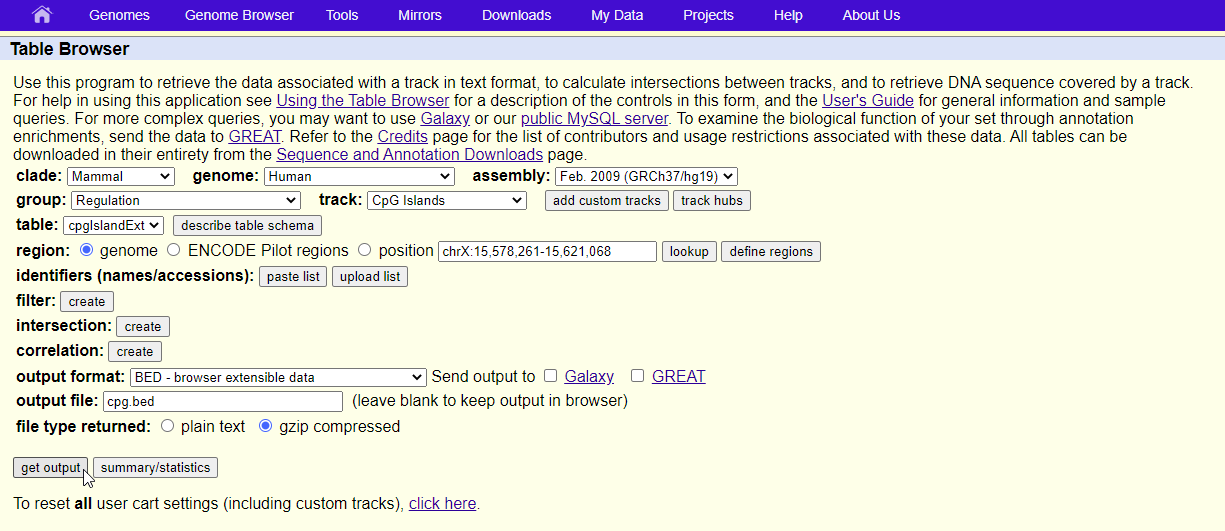 |
- Set assembly to Feb. 2009 (GRCh37/hg19)
- Set group to Regulation
- Set track to CpG Islands
- Set table to cpgIslandExt
- Set output format to BED
- Set output file to cpg.bed
- Select get output
...
| Numbered figure captions | ||||
|---|---|---|---|---|
| ||||
|
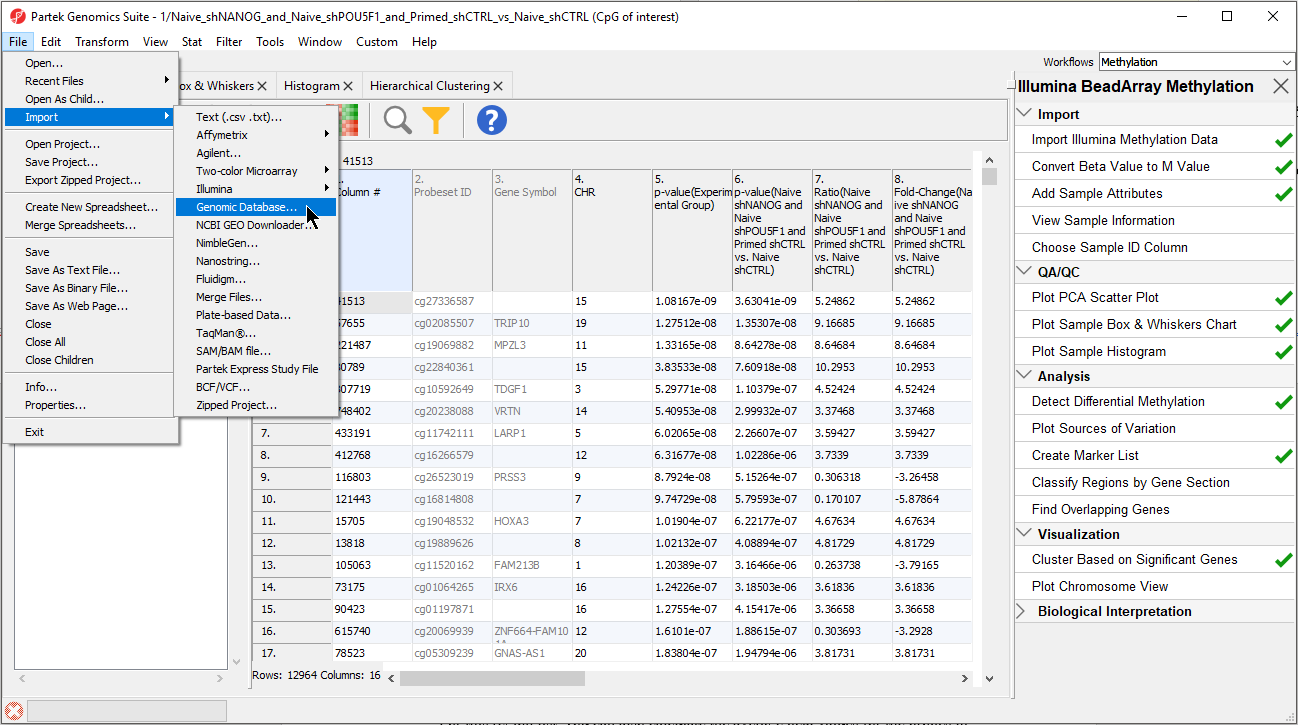
- Select the file cpg.bed
The BED file will open as a new spreadsheet (Figure 5).
- Change the spreadsheet name to UCSC CpG Island Annotation and save it
For this region list, you can also calculate the average beta values for the probes in each island per sample and detect differential methylated CpG islands regions. Detailed information on how to get average beta value for each CpG can be found from the in the Determining the average values for a region list section of Help>On-line Tutorials>User Guides> Listof Starting with a list of genomic regions.
| Additional assistance |
|---|
| Rate Macro | ||
|---|---|---|
|
...
Overview
Content Tools