Page History
| Table of Contents | ||||||
|---|---|---|---|---|---|---|
|
Use Principle Components Analysis (PCA) to reduce dimensions
- Click the Normalized counts data node
- Expand the Exploratory analysis section of the task menu
- Click PCA
...
From this PCA node, further exploratory tasks can be performed (e.g. t-SNE, UMAP, and Graph-based clustering).
Classify cells based on a marker for expression
- Choose Style under Configure
- Color by and search for fasn by typing the name
- Select FASN from the drop-down
...
- Click FASN in the legend to make it draggable (pale green background) and continue to drag and drop FASN to Add criteria within the Select & Filter Tool
- Hover over the slider to see the distribution of FASN expression
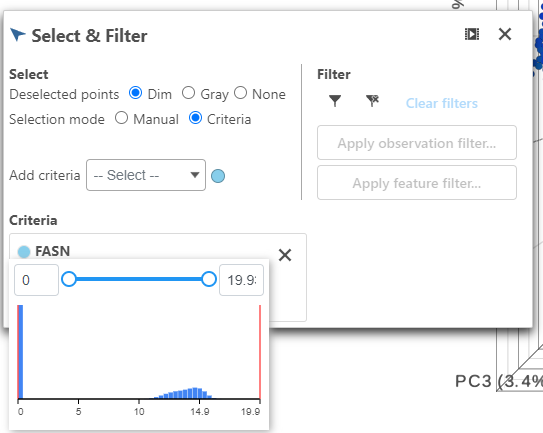
Multiple gene thresholds can be used in this type of classification by performing this step with multiple markers.
- Drag the slider to select the population of cells expressing high FASN (the cutoff here is 10 or the middle of the distribution).
...
- Open Classify
- Click Classify selection and name this population of cells "FASN low"
- Click Apply classifications and give the classification a name "FASN expression"
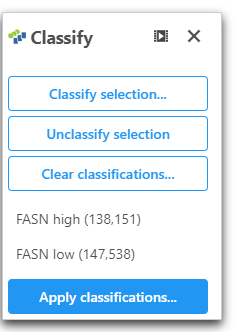
Now we will be able to use this classification in downstream applications (e.g. differential analysis).
...
Overview
Content Tools