Page History
...
| Numbered figure captions | ||||
|---|---|---|---|---|
| ||||
|

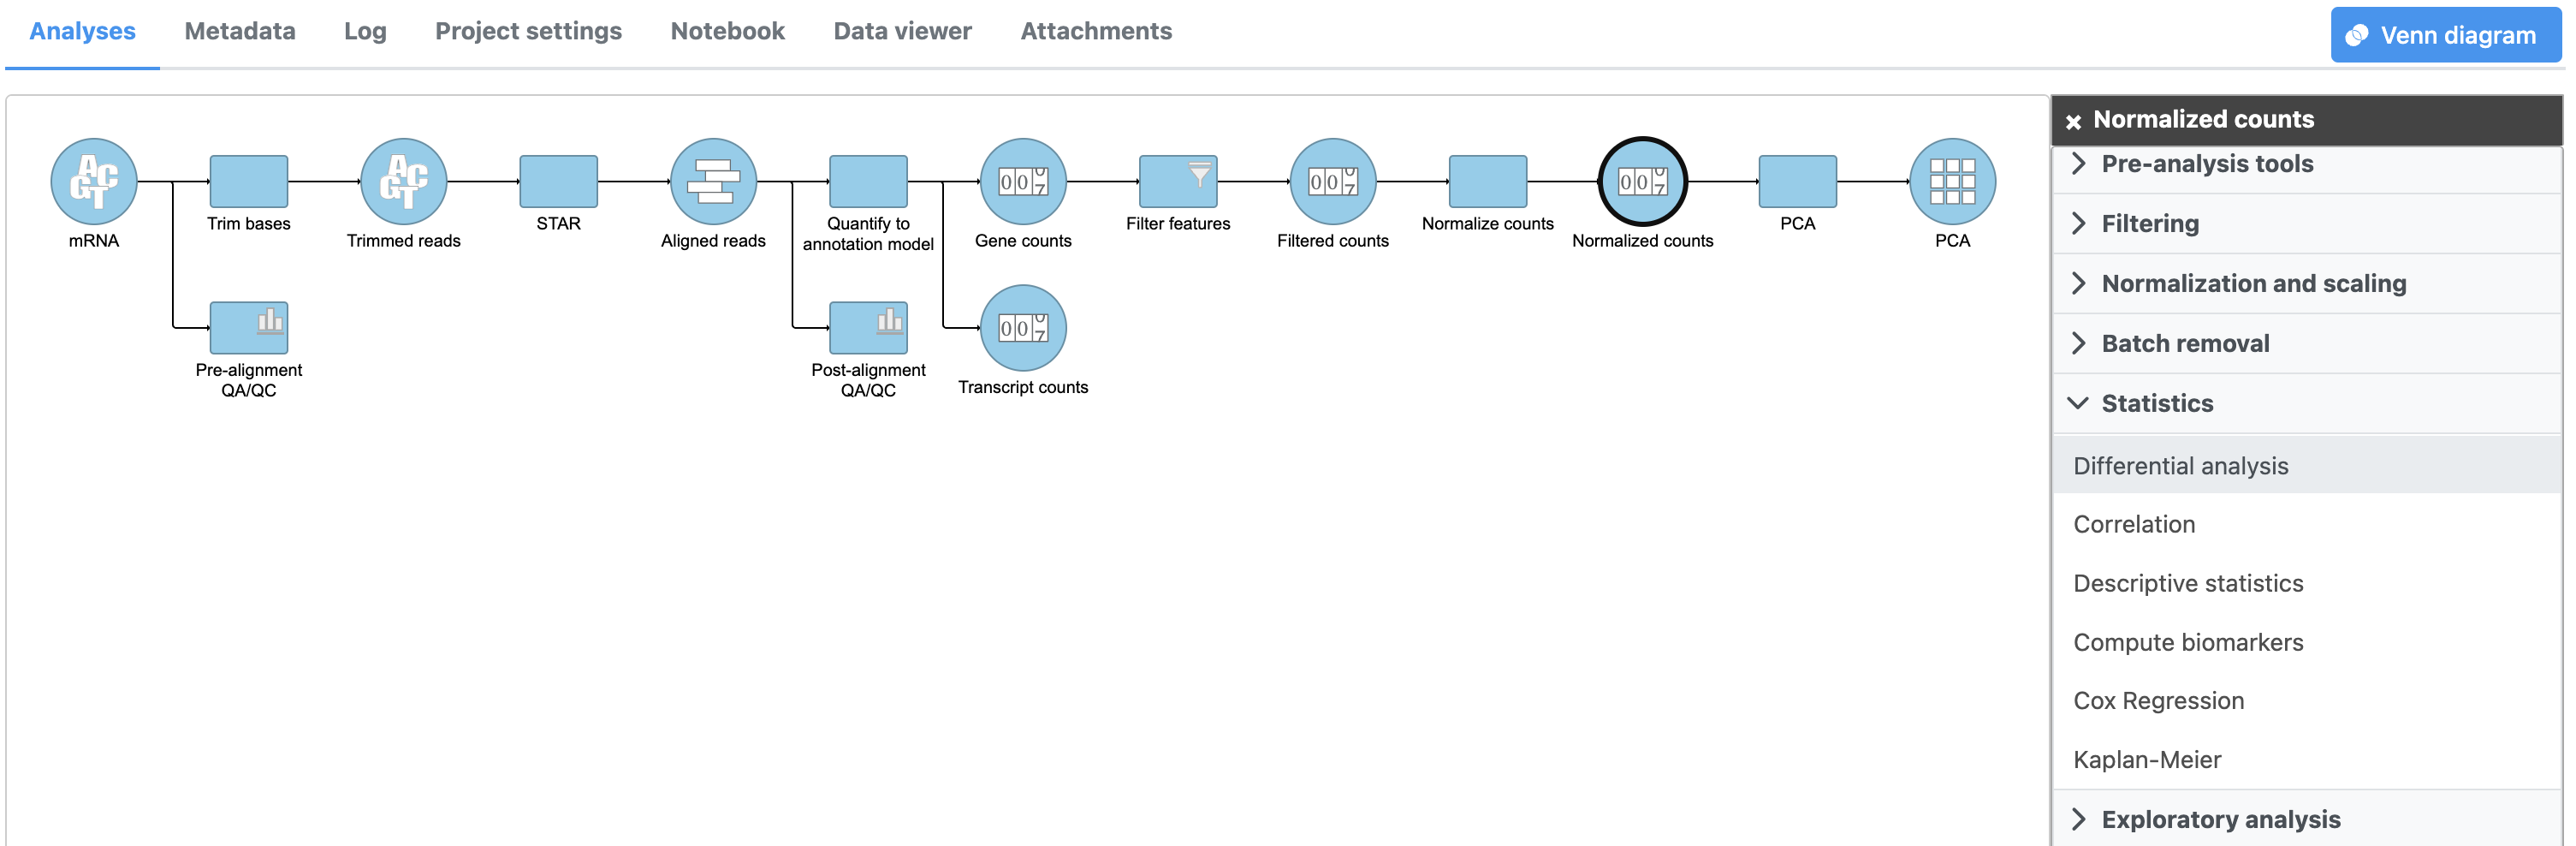
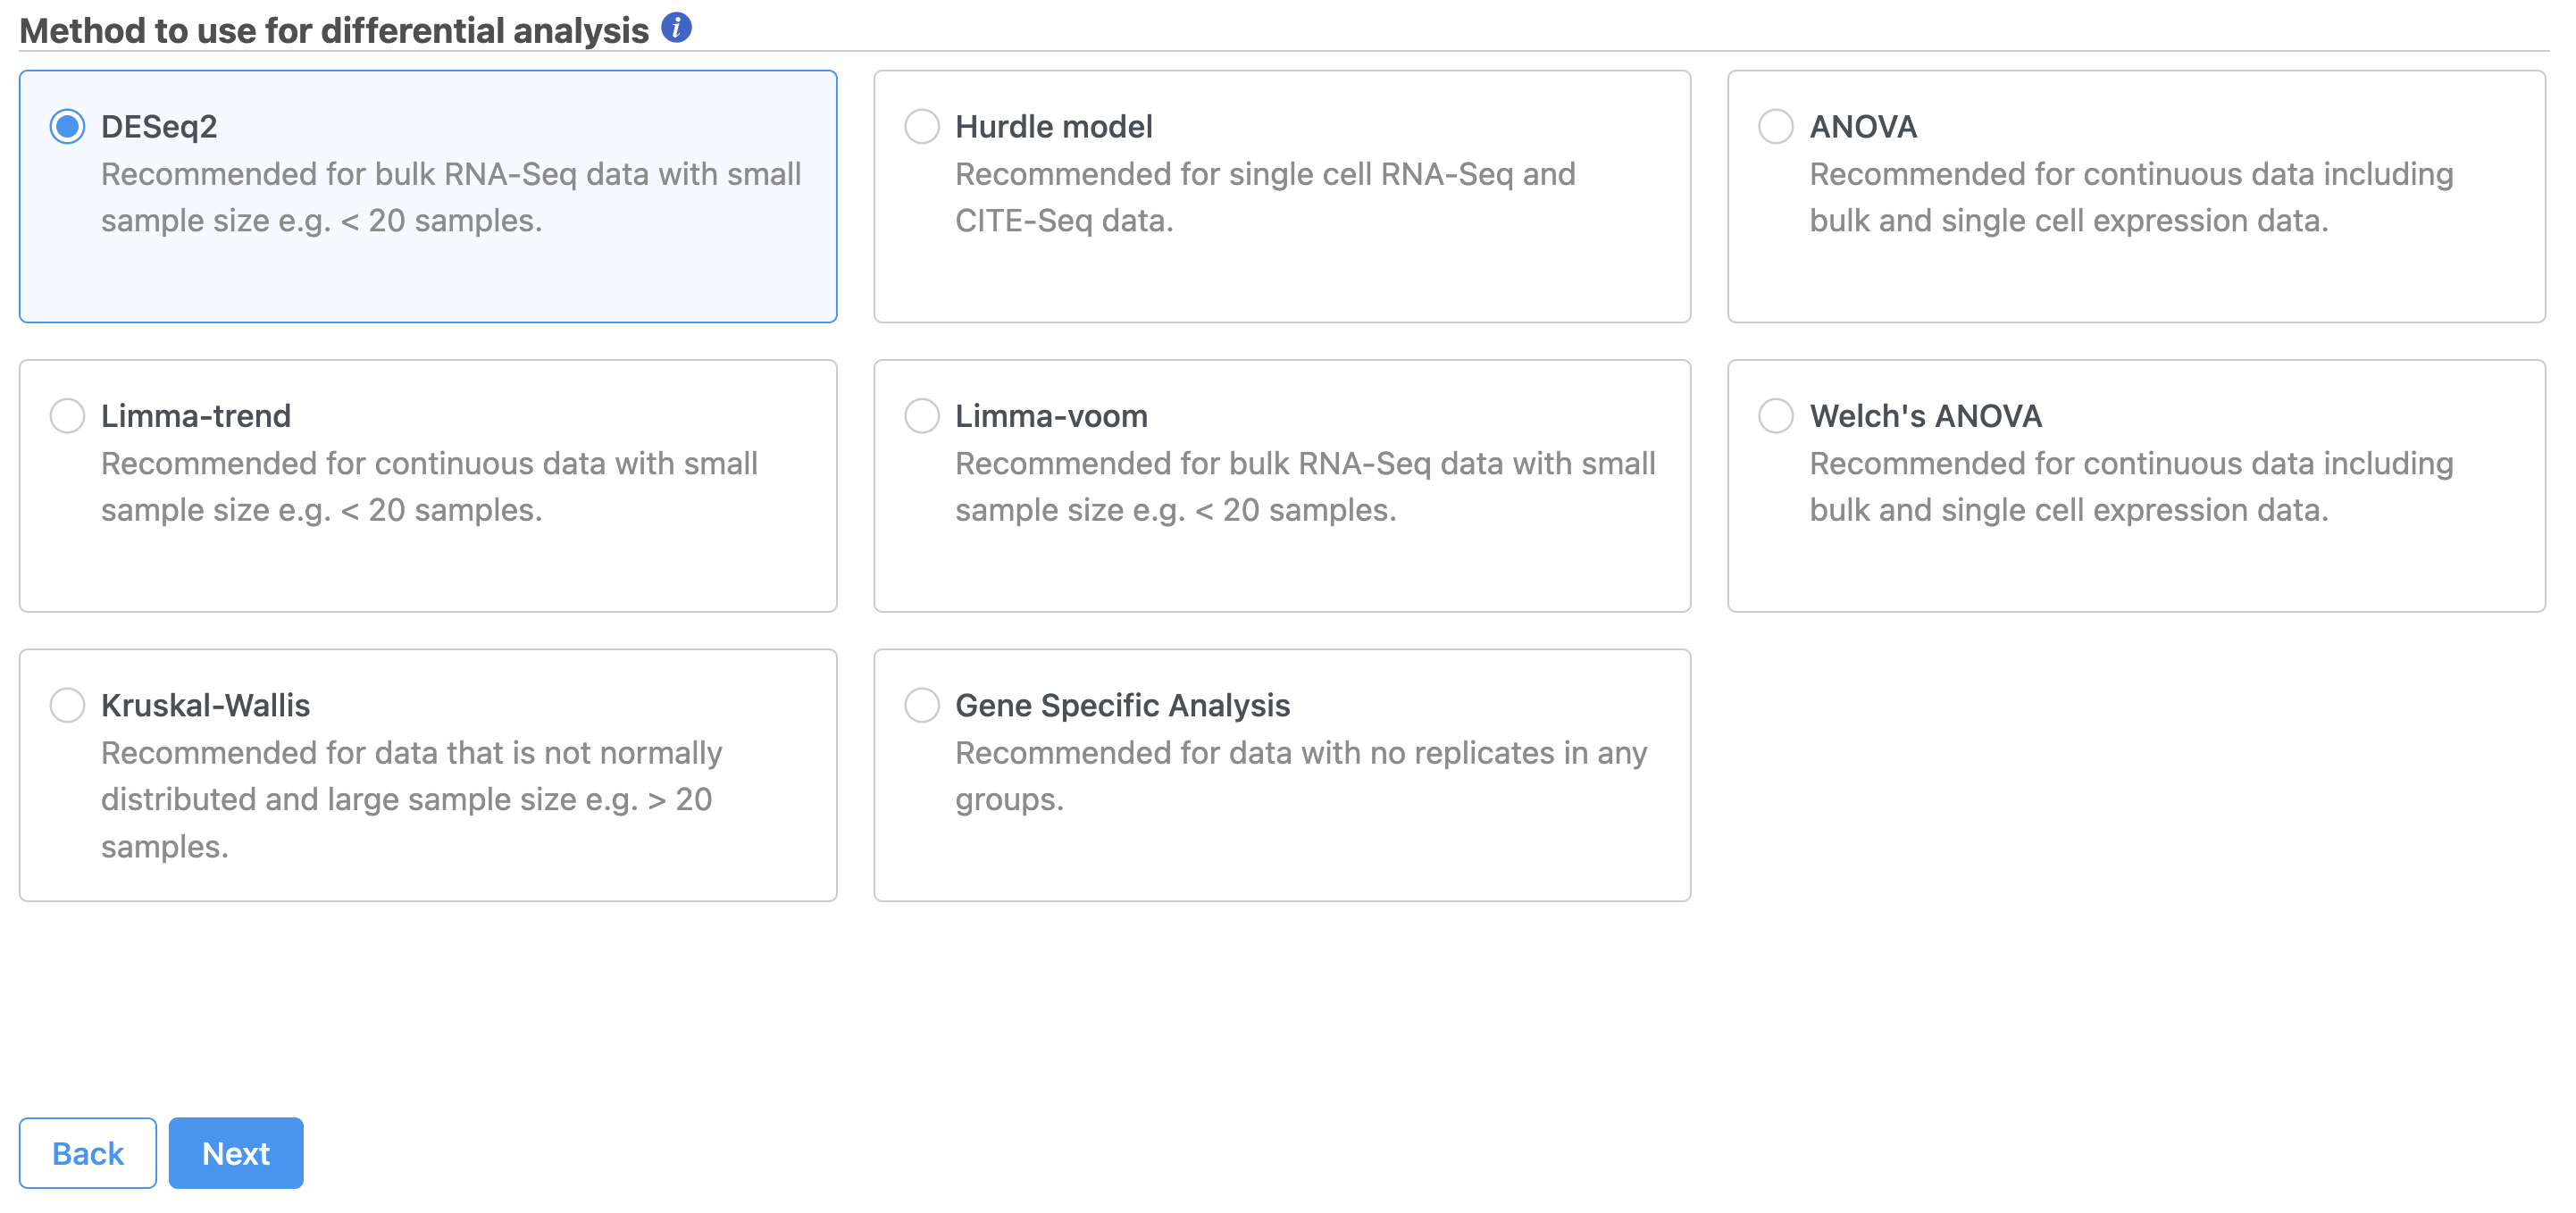
Select the appropriate differential analysis method (Figure 2). In this tutorial we are going to use GSADESeq2, but but Partek Flow ® Flow® offers a number of alternatives. Hover the mouse over the [...] ![]() symbol for more informationsinformation on each differential analysis method, or see our Differential Analysis user guide for a more in-depth look.
symbol for more informationsinformation on each differential analysis method, or see our Differential Analysis user guide for a more in-depth look.
...
| Numbered figure captions | ||||
|---|---|---|---|---|
| ||||
|

...
|
- Check 5-AZA Dose and click Add factors to add the attribute to the statistical model.
| Numbered figure captions | ||||
|---|---|---|---|---|
| ||||
|

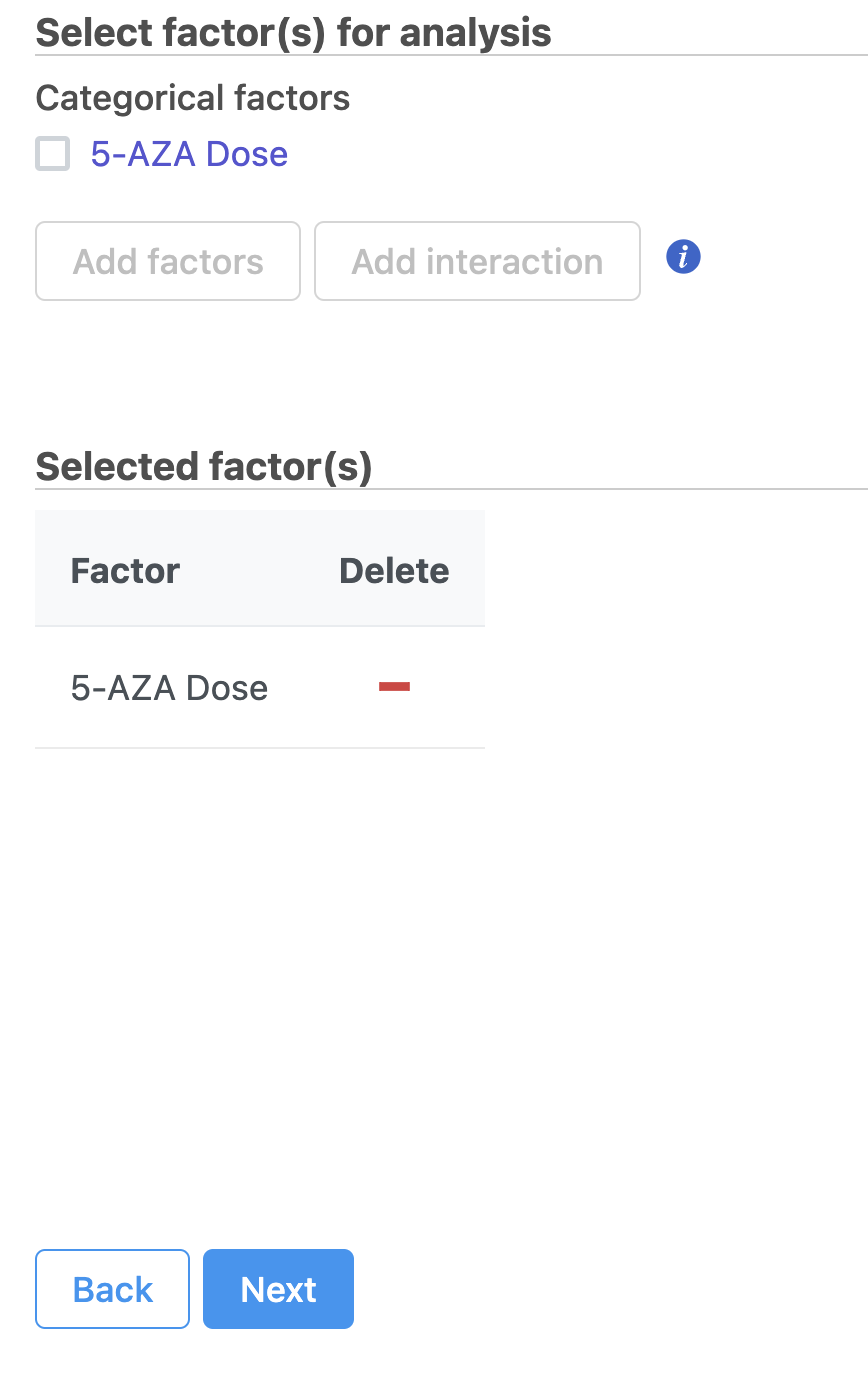
- Select Next to continue with 5-AZA Dose as the selected attribute
...
| Numbered figure captions | ||||
|---|---|---|---|---|
| ||||
|

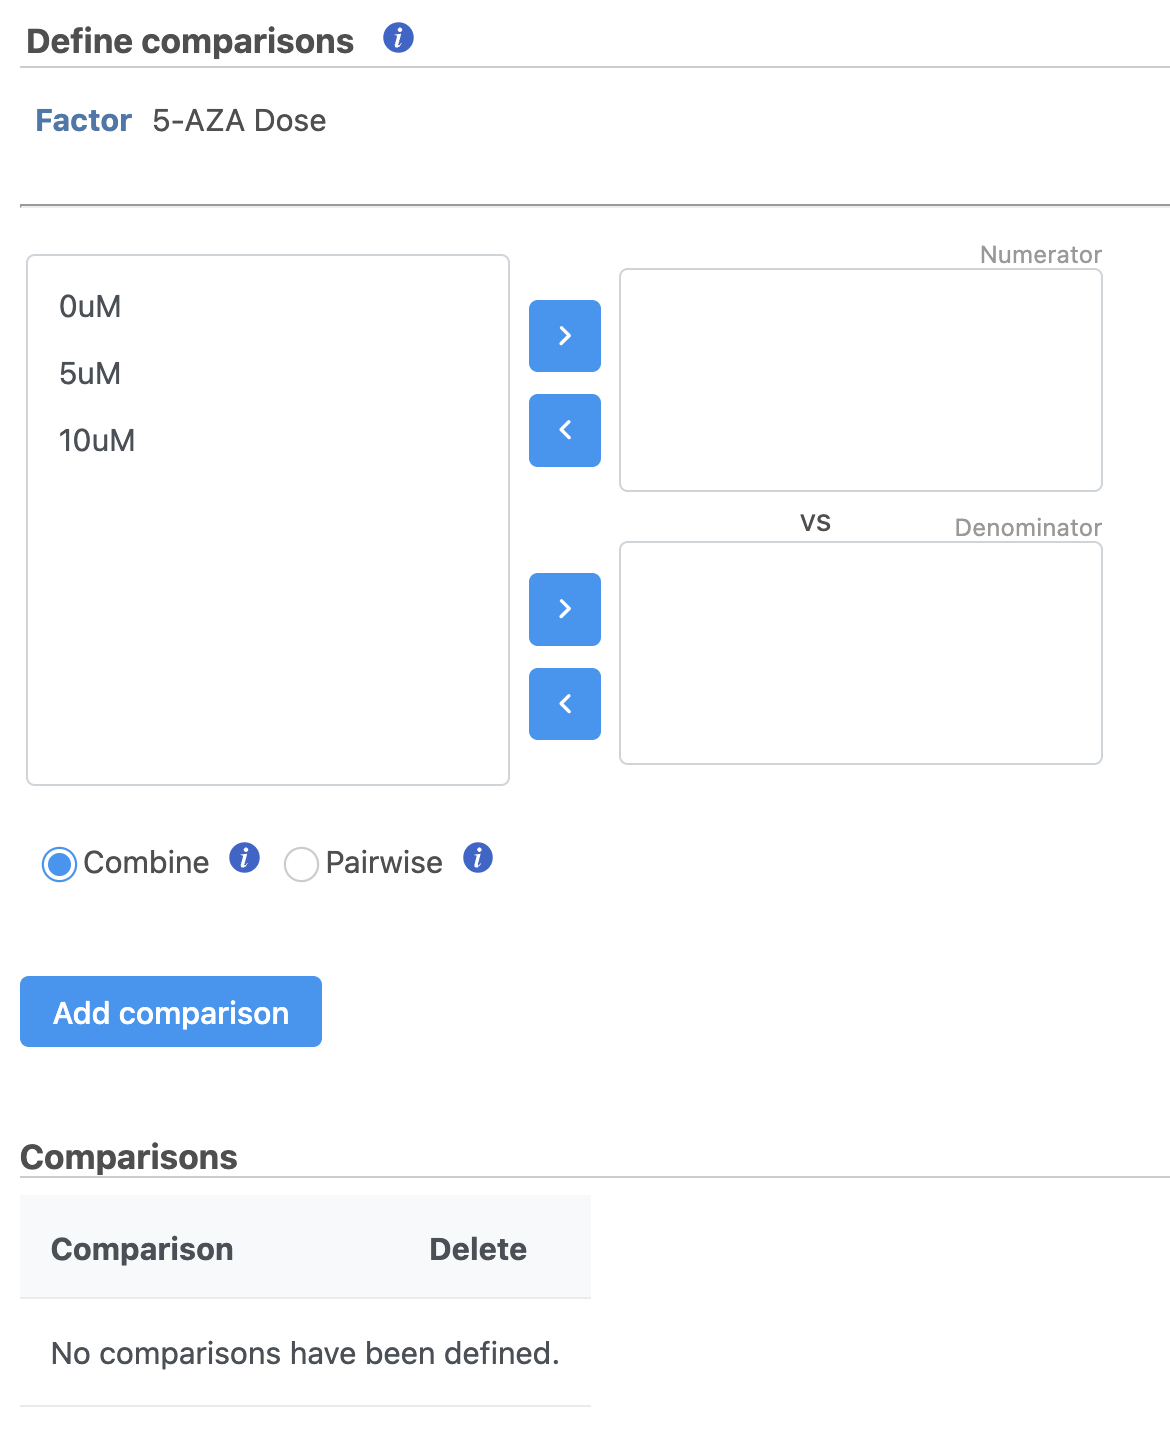
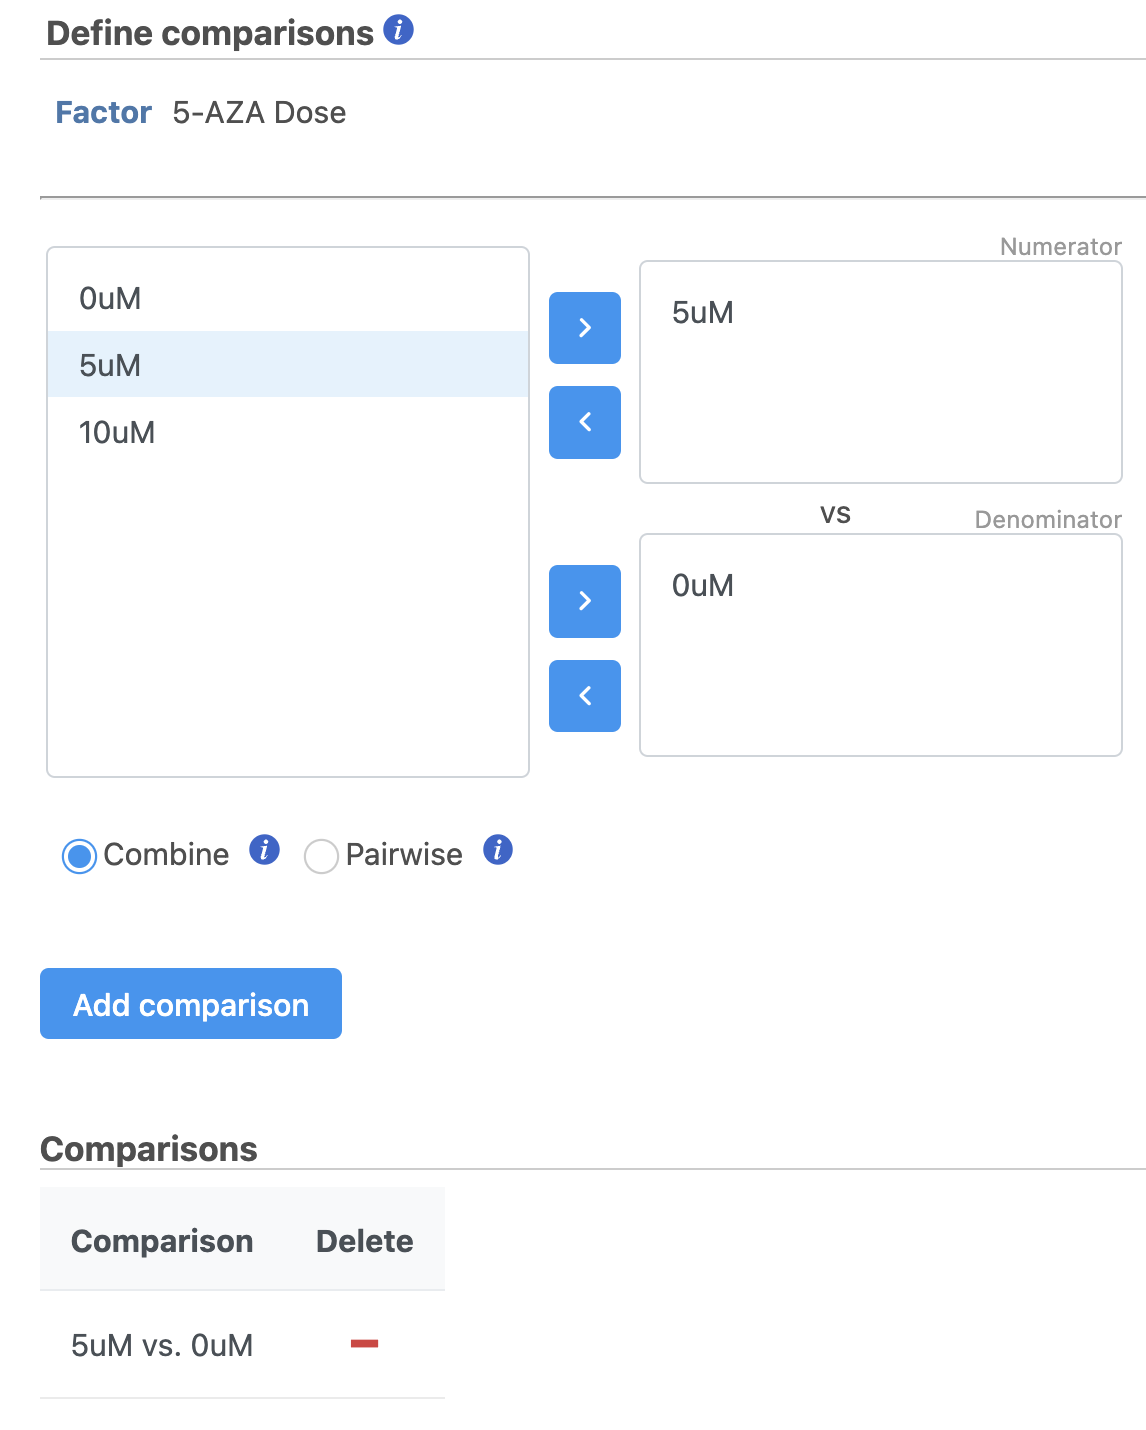
It is easiest to think about comparisons as the questions we are asking. In this case, we want to know what are the differentially expressed genes between untreated and treated cells. We can ask this for each dose individually and for both collectively.
The upper box will be the numerator and the lower box will be the denominator in the comparison calculation so we will select the 0μM control in the lower box.
- Select Drag 5μM in to the upper box
- Select 0μM in Drag 0μM to the lower box
- Click Add comparison to add 5μM vs. 0μM to the comparison table (Figure 5)
| Numbered figure captions | ||||
|---|---|---|---|---|
| ||||
|

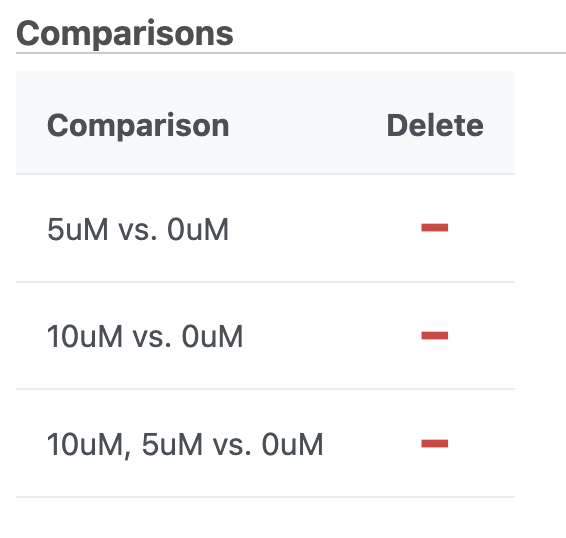
- Repeat to create comparisons for 10μM vs. 0μM and 5μM:and 10μM,5μM vs. 0μM (Figure 6)
| Numbered figure captions | ||||
|---|---|---|---|---|
| ||||
|

By default, the GSA will use a lognormal with shrinkage model for its analysis of variance of each gene. This is appropriate for most data sets and will tend to give accurate and reproducible results. To learn more about the advanced options available in the GSA task, please see the GSA user guide.
|
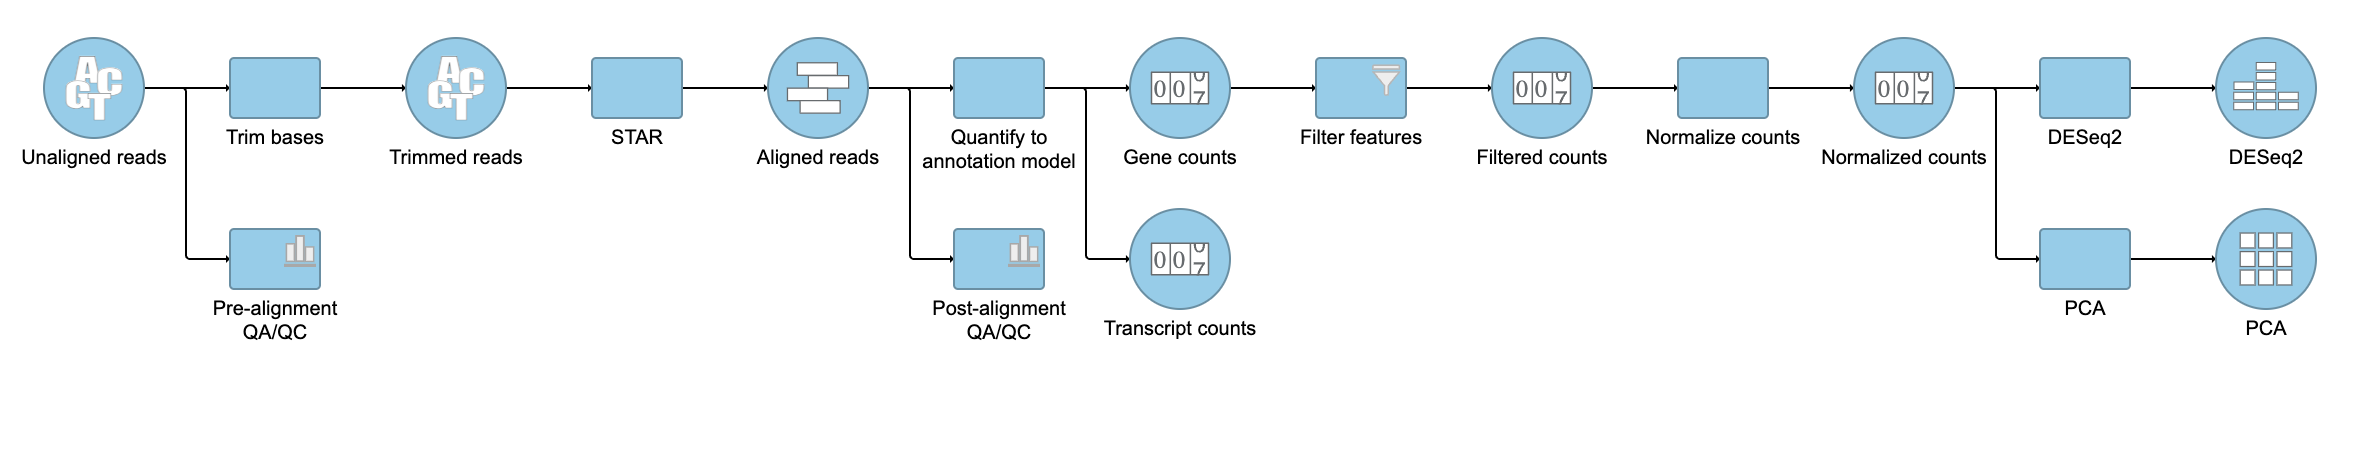
- Click Finish to perform GSA DESeq2 as configured
A GSA DESeq2 task node and a GSA DESeq2 data node will be added to the pipeline (Figure 7).
...
| Numbered figure captions | ||||
|---|---|---|---|---|
| ||||
|

| Page Turner | ||
|---|---|---|
|
...
Overview
Content Tools