| Table of Contents |
|---|
| maxLevel | 2 |
|---|
| minLevel | 2 |
|---|
| exclude | Additional Assistance |
|---|
|
After alignment has completed, we can view the quality of alignment by performing post-alignment QA/QC.
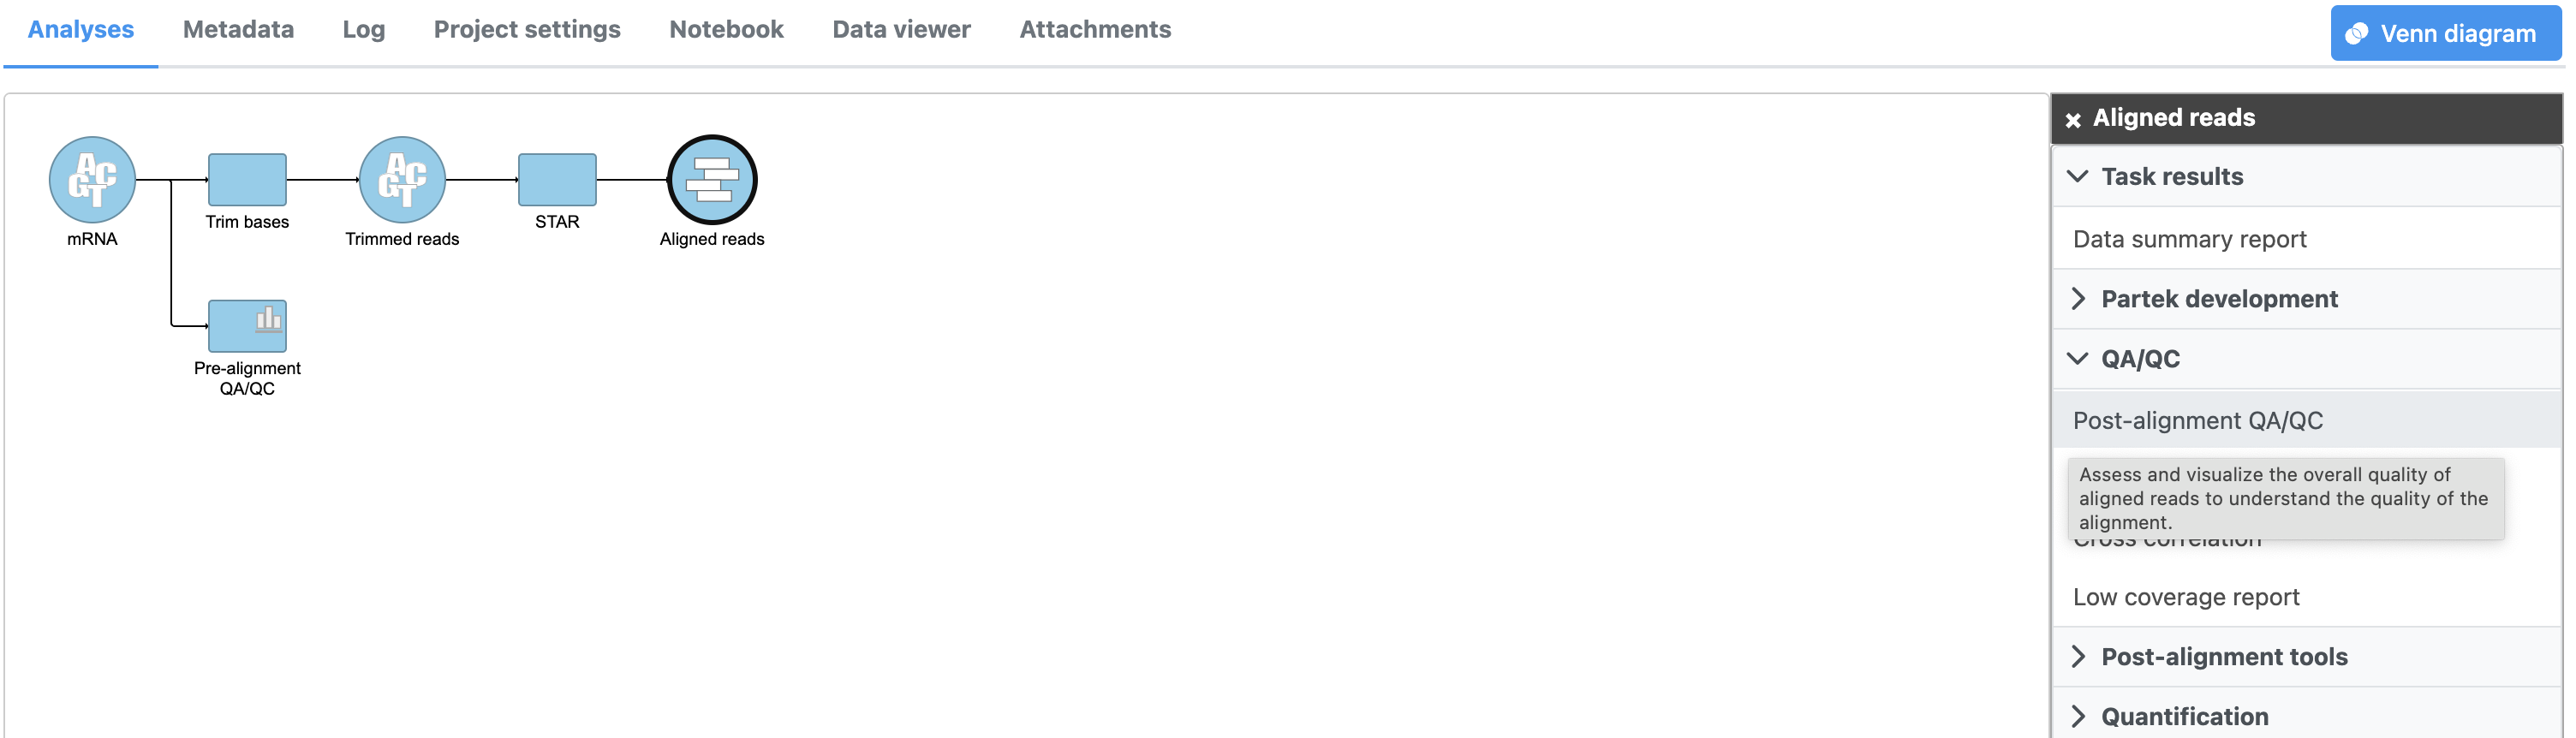
- Click the Aligned reads data node
- Click QA/QC inthe task menu
- Click Post-alignment QA/QC from the QA/QC section of the task menu (Figure 1)
| Numbered figure captions |
|---|
| SubtitleText | Invoking Post-alignment QA/QC |
|---|
| AnchorName | Invoking post-alignment QA/QC |
|---|
|
|
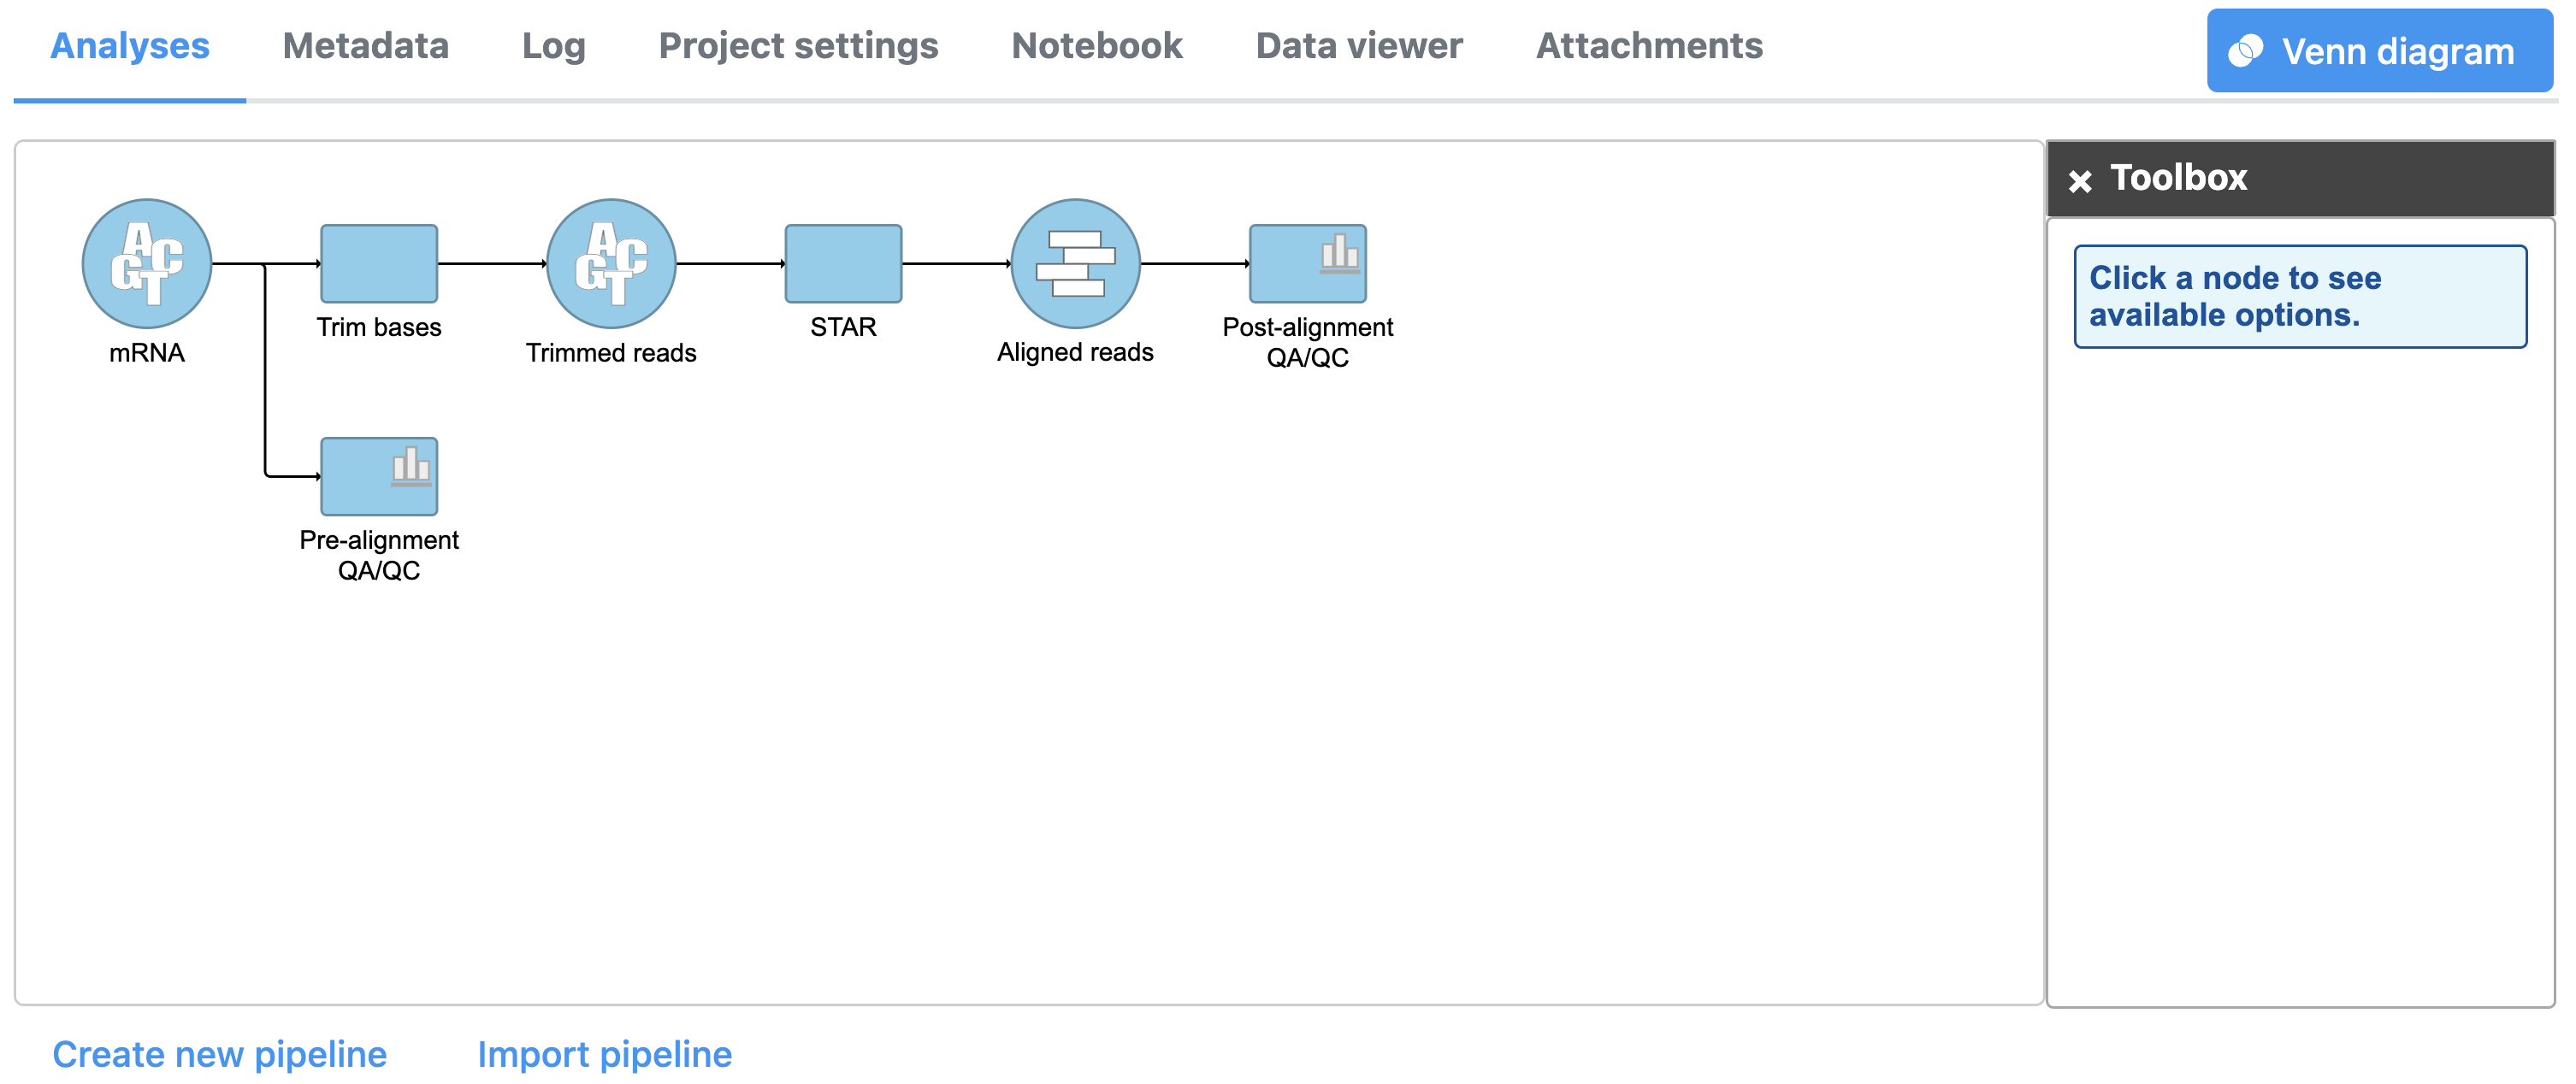
A Post-alignment QA/QC task node will be generated (Figure 2).
| Numbered figure captions |
|---|
| SubtitleText | Post-alignment QA/QC task node |
|---|
| AnchorName | Post-alignment QA/QC task node |
|---|
|
|
- Double-click the Post-alignment QA/QC task node to view the task report
Similar to the Pre-alignment QA/QC task report, general quality information about the whole data set is displayed and sample-level reports can be opened by clicking a sample name in the table.
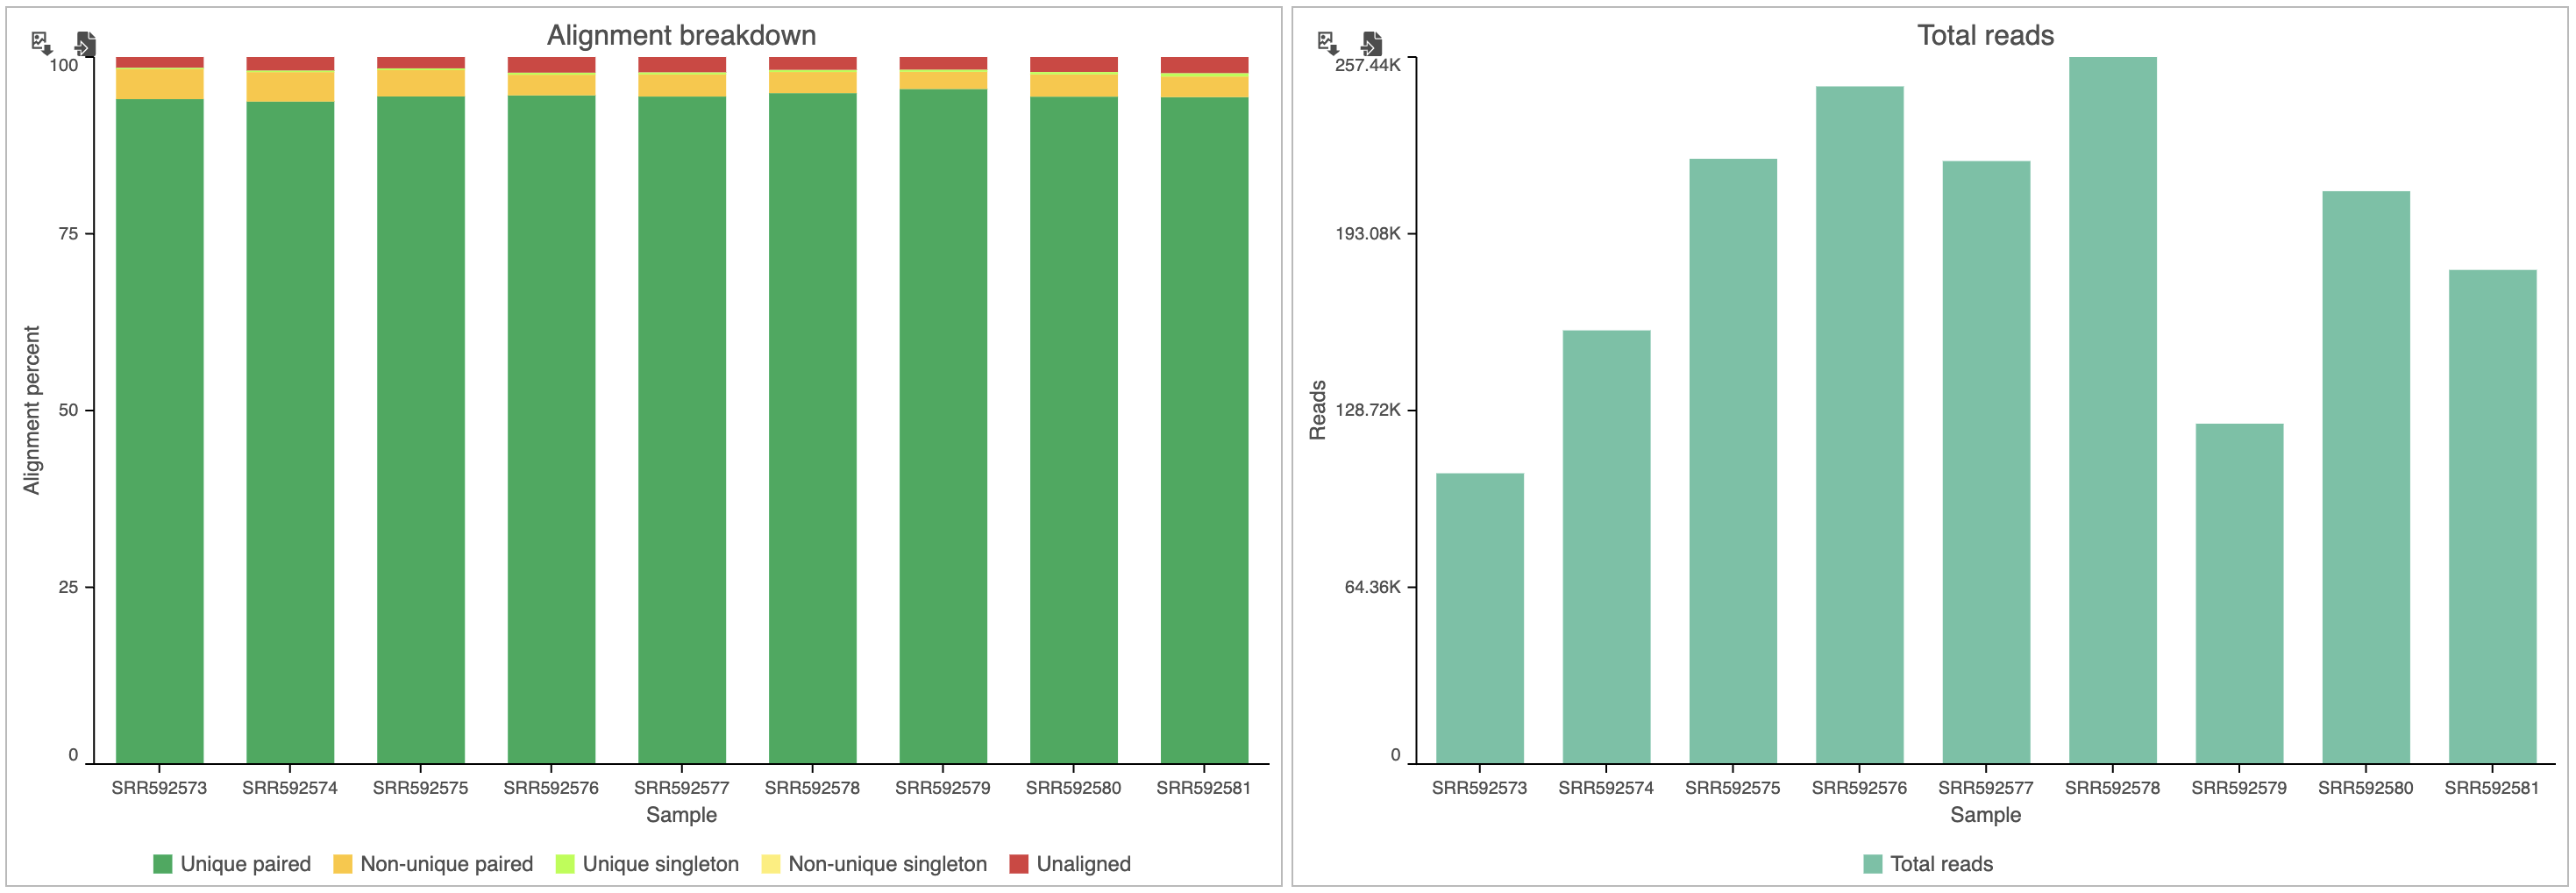
The top two graphs in the data set view (Figure 3) show the alignment breakdown and coverage.
| Numbered figure captions |
|---|
| SubtitleText | Alignment statistics for the data set |
|---|
| AnchorName | Alignment breakdown |
|---|
|
|
From these graphs, we can see that more than 95% of reads were aligned, but the total number of reads for each sample varies. Normalizing for the variability in total read counts will be addressed in a later section of the tutorial.
For more information about the graphs and information presented in the Post-alignment QA/QC task report, see the Post-alignment QA/QC user guide.