Page History
| Table of Contents | ||||||
|---|---|---|---|---|---|---|
|
The volcano plot can be used to visualize displays p-values and fold-changes of numerous genomic features (e.g., genes or probe sets) at the same time. This allows differentially expressed genes to be quickly identified and saved as a gene list.
...
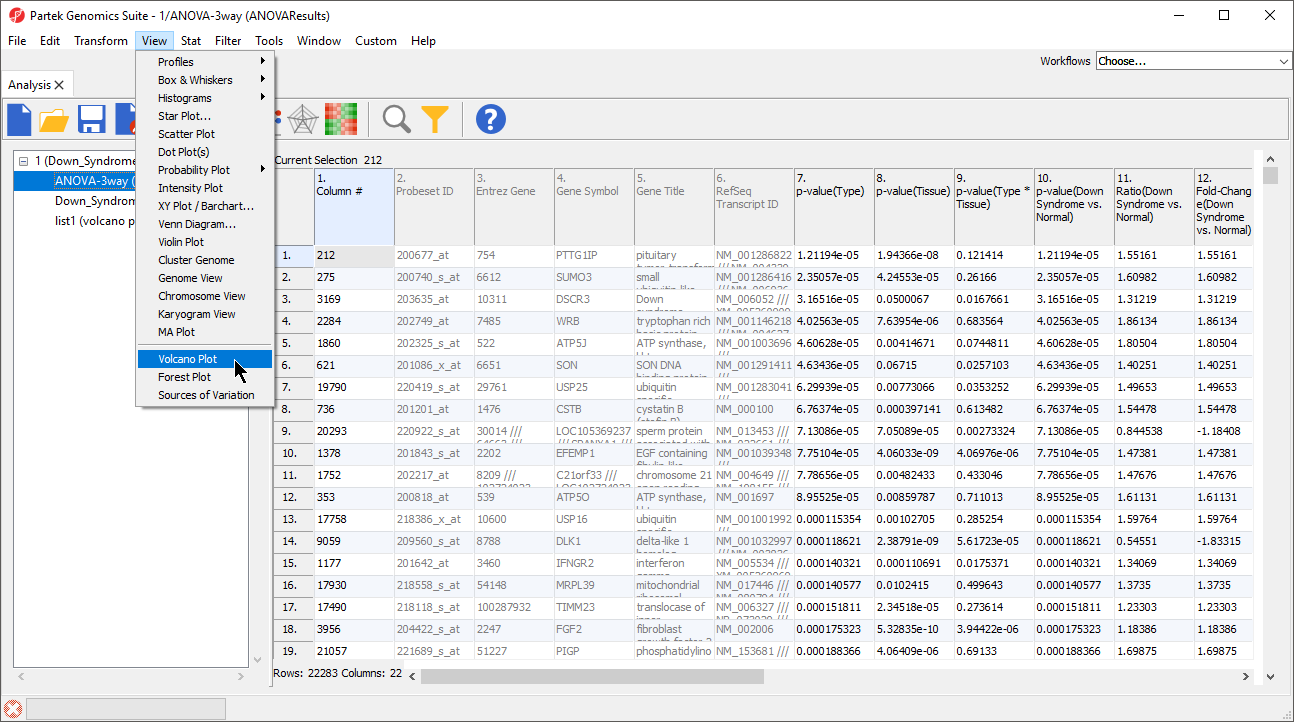
We will invoke a volcano plot from an ANOVA results child spreadsheet with genes on rows.
- Select View from the main toolbar
- Select Volcano Plot (Figure 1)
| Numbered figure captions | ||||
|---|---|---|---|---|
| ||||
|
The Volcano Plot Configure dialog will open (Figure 2).
| Numbered figure captions | ||||
|---|---|---|---|---|
| ||||
|
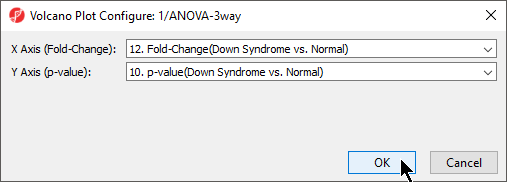
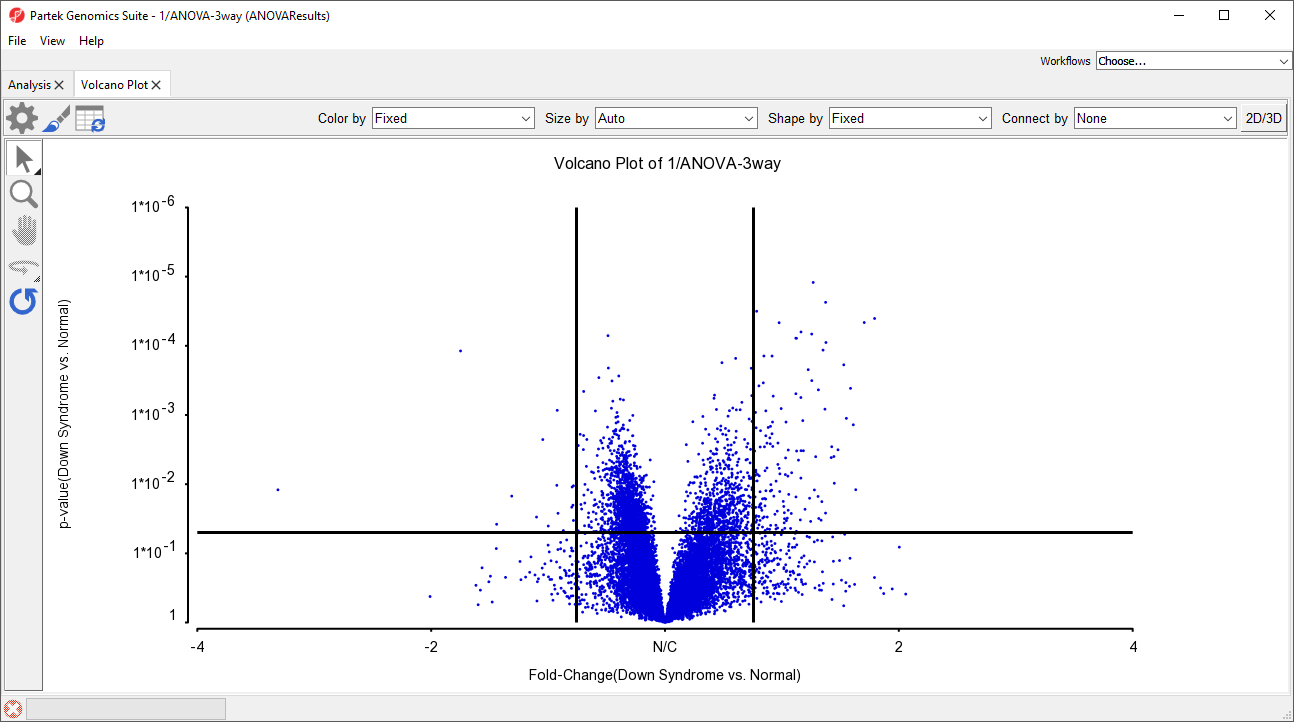
- Select the fold-change and p-value columns you would like to visualize from the ANOVA results spreadsheet; here we have chosen 12. Fold-Change(Down Syndrome vs. Normal) for the X Axis and 10. p-value(Down Syndrome vs. Normal) for Y Axis
- Select OK
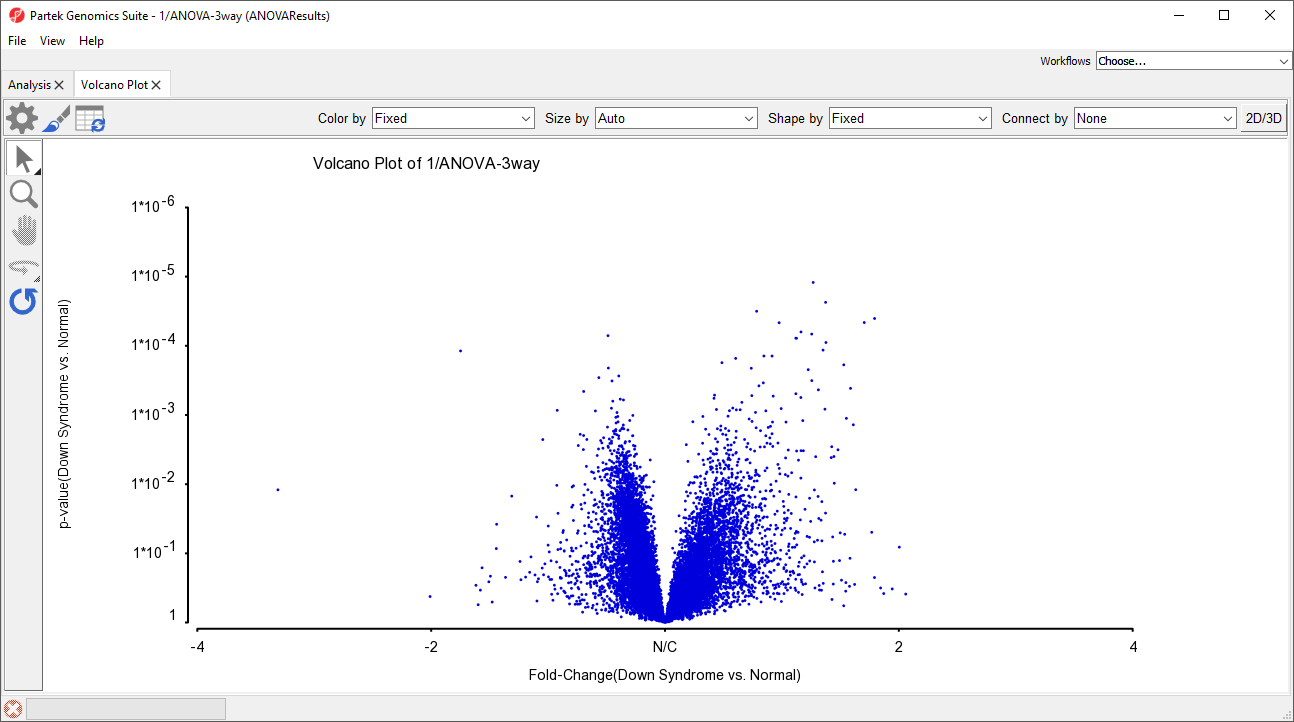
The volcano plot will open in a new tab (Figure 3). Control and color options for the volcano plot are largely similar to those described for a dot plot. On volcano plots with many probe(sets)/genes, the shapes and sizes of individual probe(sets)/genes will not be visible until they are selected.
| Numbered figure captions | ||||
|---|---|---|---|---|
| ||||
|
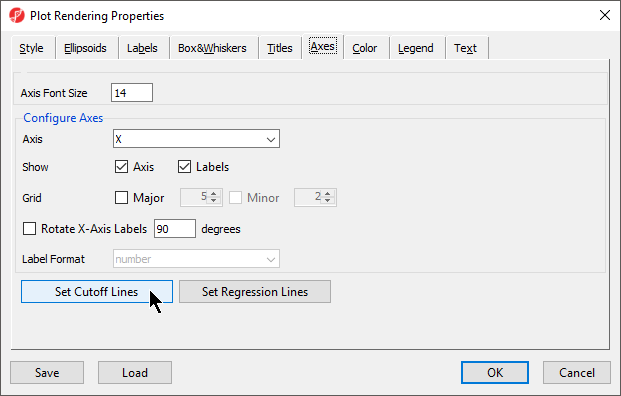
- Select (
 )
) - Select the Axes tab
- Select Set Cutoff Lines (Figure 4)
| Numbered figure captions | ||||
|---|---|---|---|---|
| ||||
|
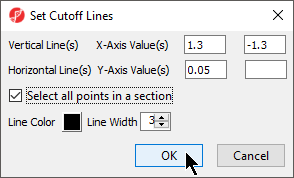
- Set Vertical Line(s) to 1.3 and -1.3
- Set Horizontal Line(s) to 0.05
- Select Select all points in a section
- Select OK (Figure 5)
| Numbered figure captions | ||||
|---|---|---|---|---|
| ||||
|
- Select OK to close the Plot Rendering Properties dialog
The volcano plot now has cutoff lines for fold-change and p-value (Figure 6).
| Numbered figure captions | ||||
|---|---|---|---|---|
| ||||
|
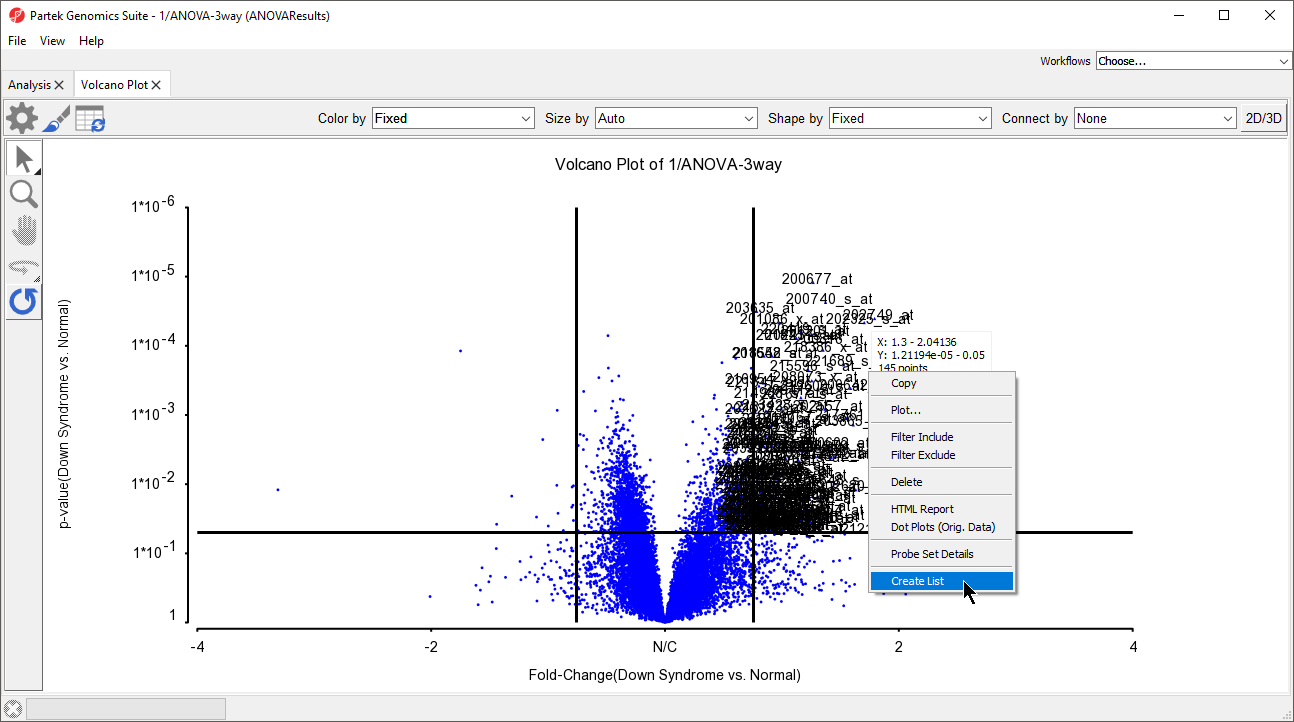
Because we selected Select all points in a section when adding the cutoff lines, selecting any of the quandrants will select all probe(sets)/genes in that quadrant. If this option is not selected, individual probe(sets)/genes or groups can be selected using selection mode. Gene lists can be generated from selected probe(sets)/genes.
If columns are selected in the ANOVA results source spreadsheet for the volcano plot, only those columns will be included in the created list.
- Select the upper right-hand quadrant of the volcano plot
- Right click the selected quadrant
- Select Create List (Figure 7)
| Numbered figure captions | ||||
|---|---|---|---|---|
| ||||
|
- Give the new list a name and description as appropriate
- Select OK
The list will be saved as a text file and open as a child spreadsheet in the Analysis tab.
| Page Turner | ||
|---|---|---|
|
| Additional assistance |
|---|
|
| Rate Macro | ||
|---|---|---|
|
...
Overview
Content Tools