Page History
...
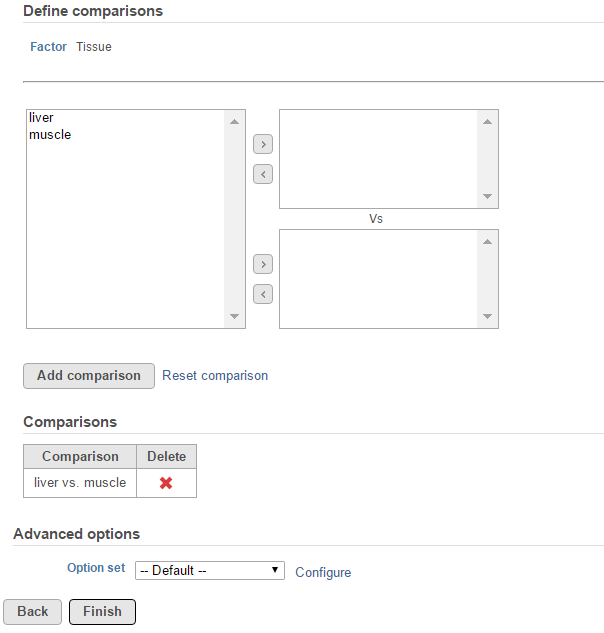
Suppose there is an experiment designed to detect transcripts showing differential expression in two tissue groups: liver vs muscle. The alt-splicing ANOVA dialog allows you to specify the ANOVA model that is tissue, the alt-splicing factor is chosen from the ANOVA factor(s), so the alt-splicing factor is also tissue (Figure 1). Click Next to setup the comparisons (Figure 2)
| Numbered figure captions | ||||
|---|---|---|---|---|
| ||||
|
...
Alt-splicing ANOVA report
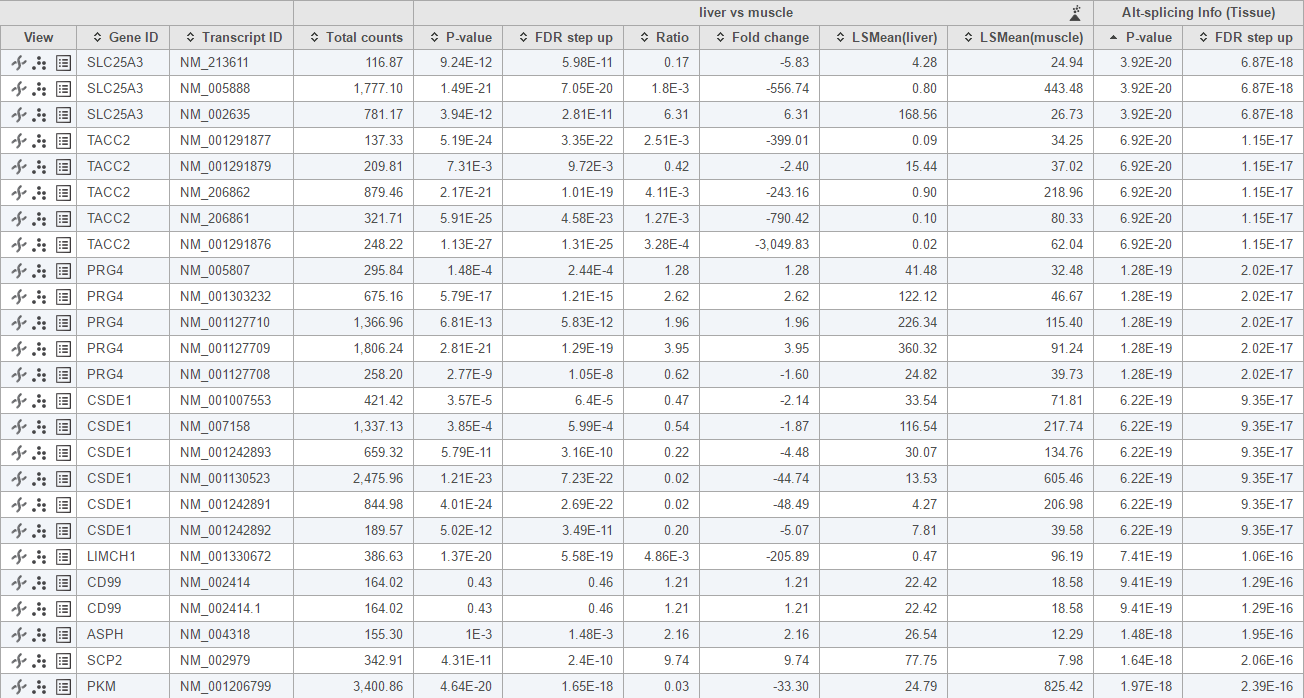
This this analysis, only genes with more than one transcripts will be included in the calculation. The report format is the same as ANOVA report, each row represent a transcript, besides statistics information on the specified comparisons, there is also Alt-splicing information at the right end of the table, this information is represented by the p-value of interaction of transcript ID with alt-splicing factor, transcripts of the same gene should have the same p-value. Small p-value indicate significance of the gene undergo alt-splicing, by default the table is sorted based on this p-value (Figure 4).
| Numbered figure captions | ||||
|---|---|---|---|---|
| ||||
|
 ) to visualize the difference (Figure 5).
| Numbered figure captions | ||||
|---|---|---|---|---|
| ||||
|
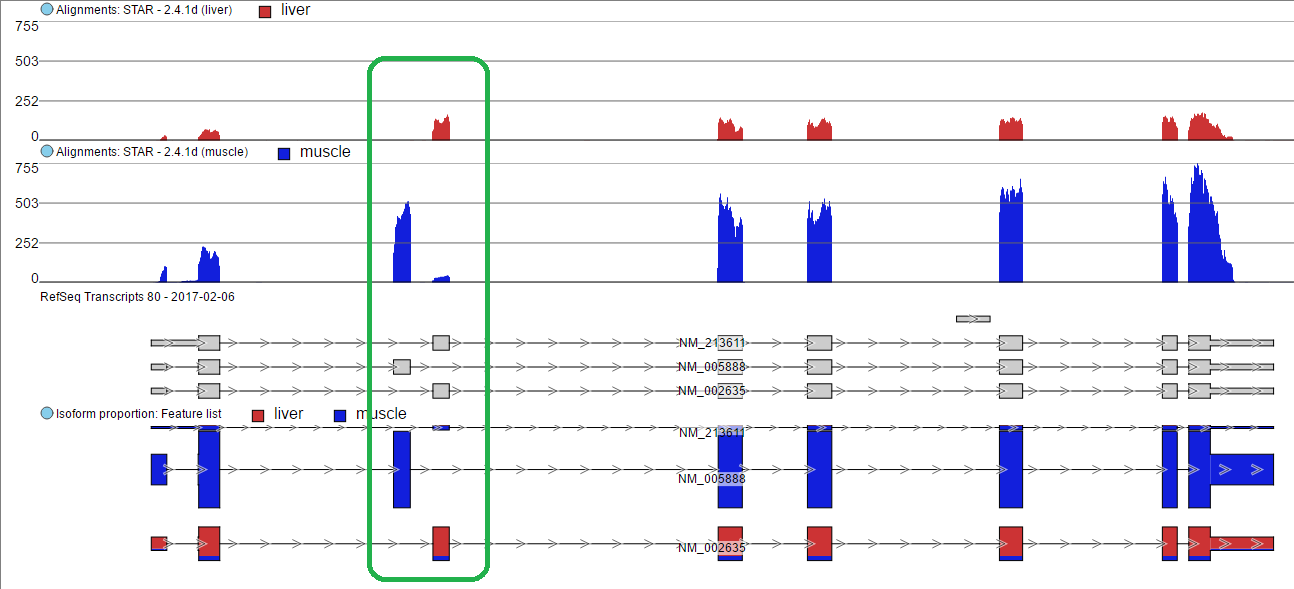
The 3rd exon is different between NM_005888 and NM_002635. Muscle primarily expressed in NM_005888 while liver primarily expressed in NM_002635.
| Additional assistance |
|---|
| Rate Macro | ||
|---|---|---|
|
...
Overview
Content Tools