Page History
...
| Numbered figure captions | ||||
|---|---|---|---|---|
| ||||
|
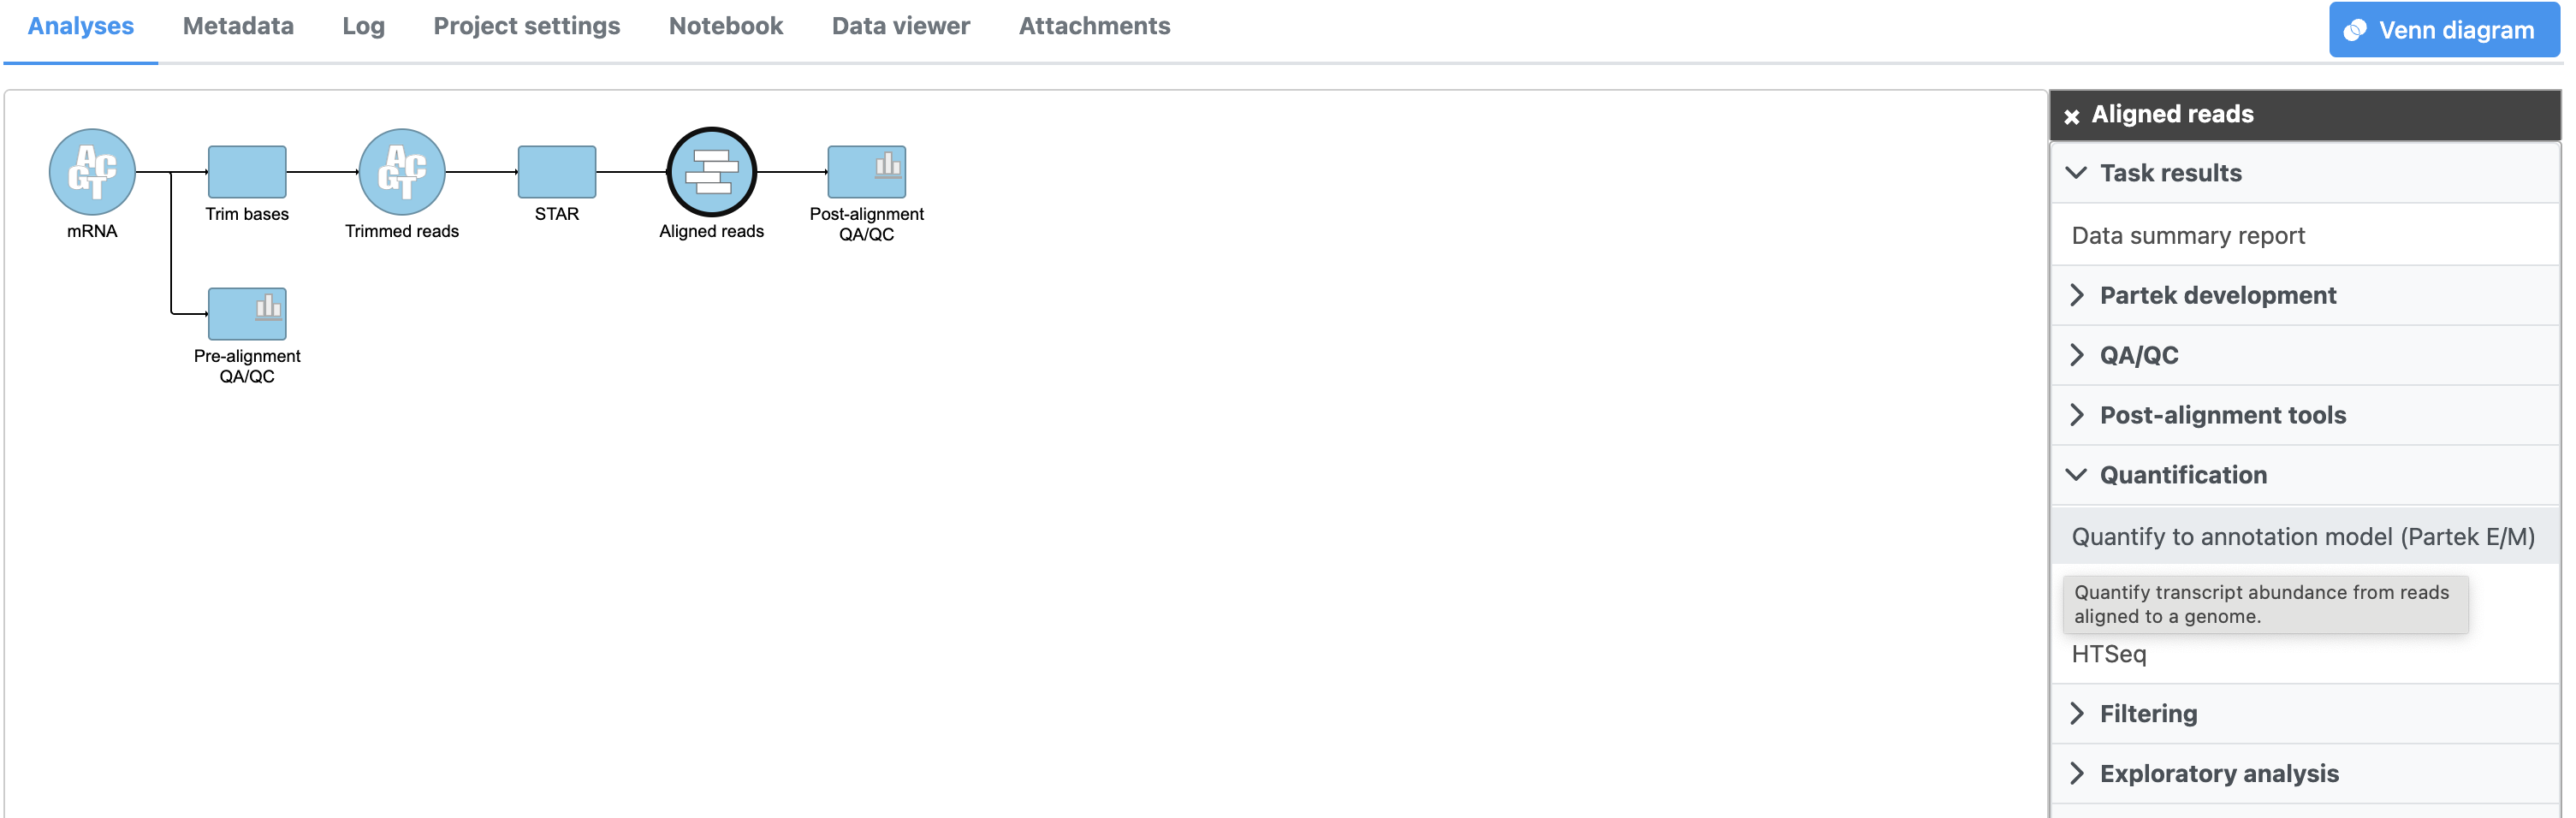
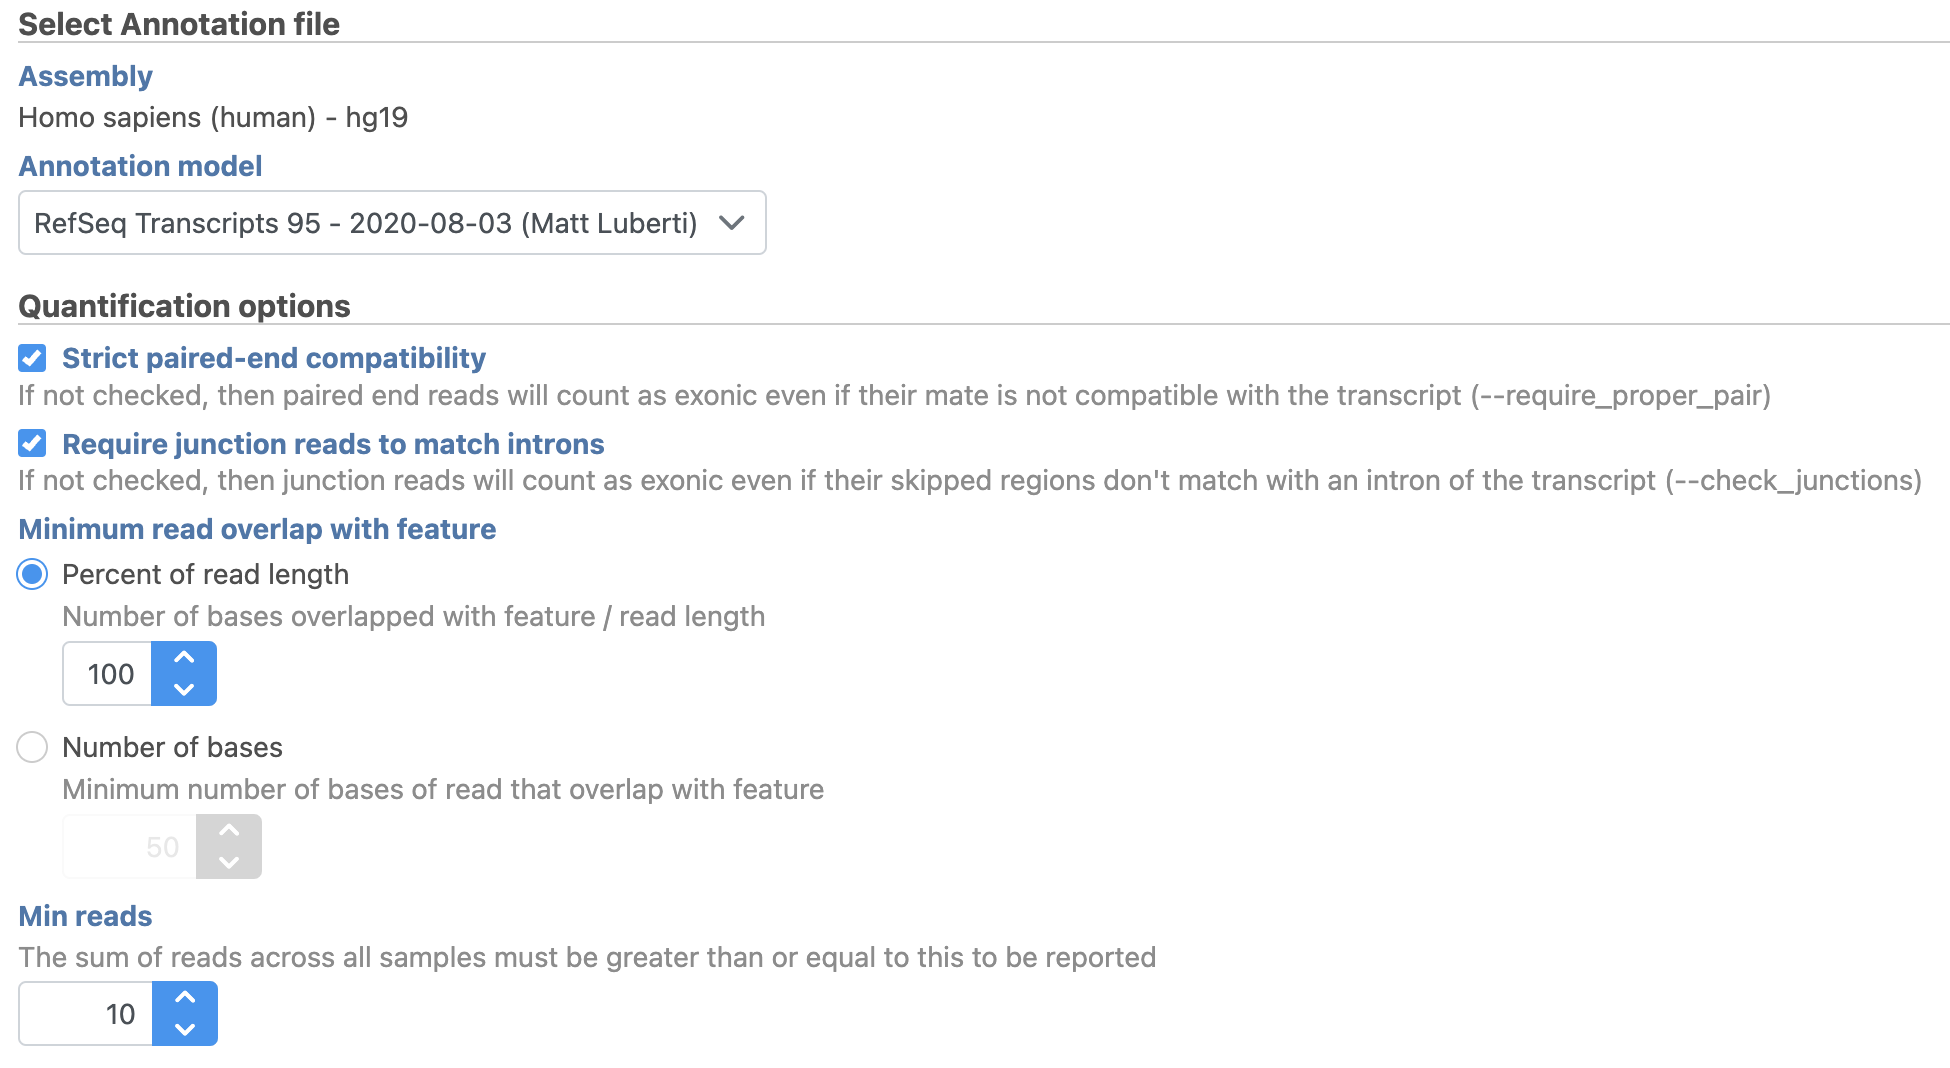
We will use the default options for quantification. To learn more about the different options, please see the Quantify to annotation model (Partek E/M) user guide or mouse over the  next to each option.
...
| Numbered figure captions | ||||
|---|---|---|---|---|
| ||||
|
The Quantify to annotation model task node outputs two data nodes, Gene counts and Transcript counts (Figure 3).
...
| Numbered figure captions | ||||
|---|---|---|---|---|
| ||||
|
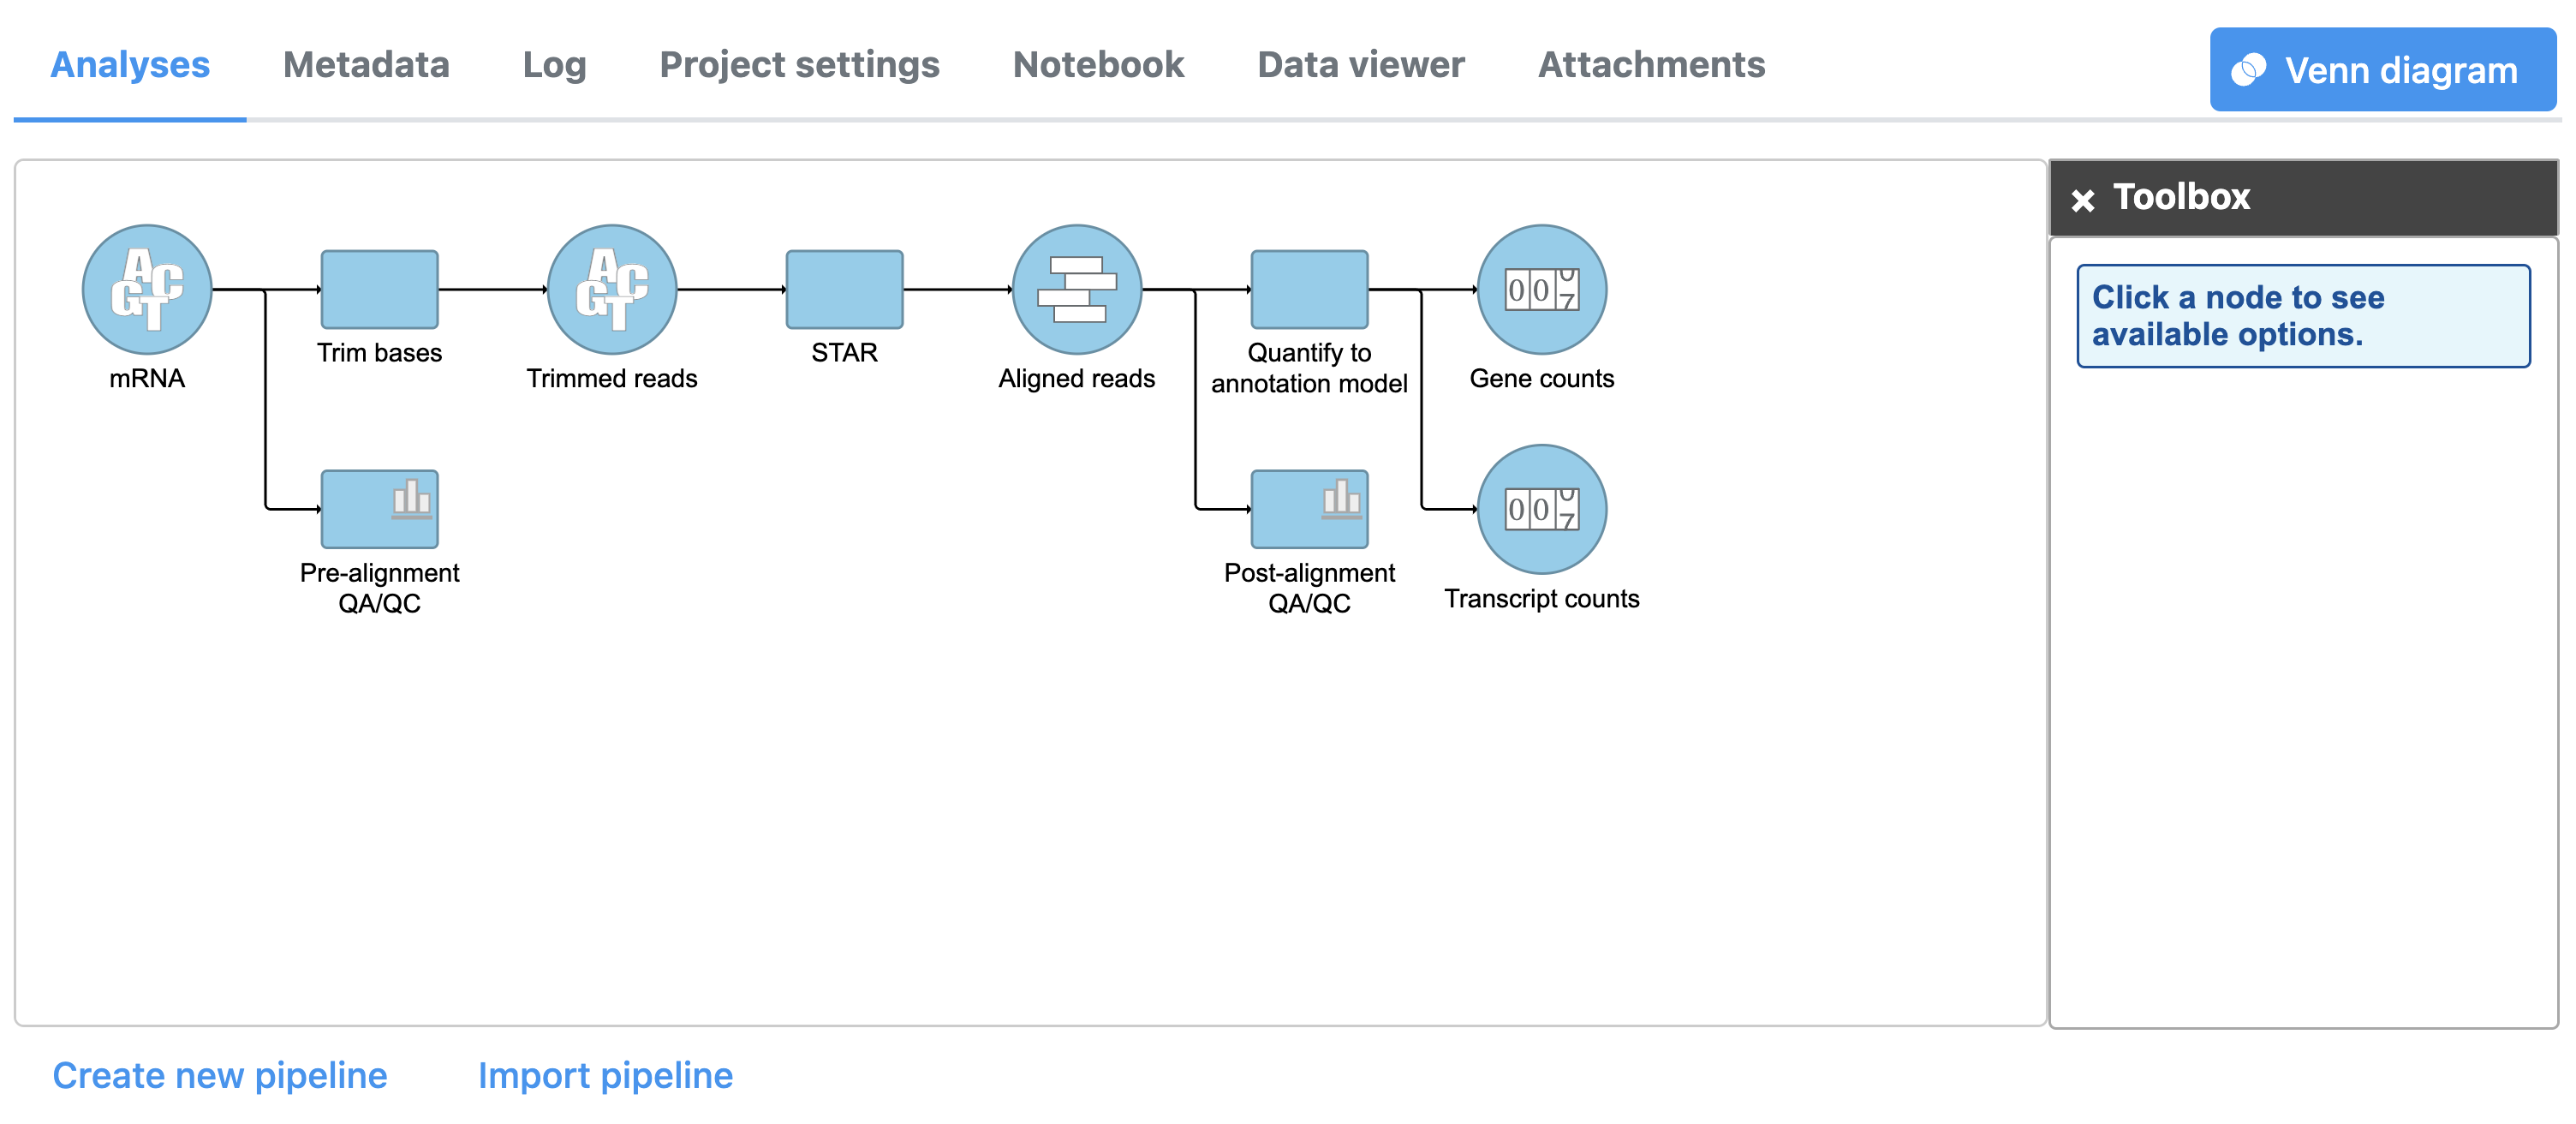
To view the results of quantification, we can select either data node output.
...
Overview
Content Tools