Page History
...
miRNAs regulate gene expression at the post-transcriptional level by base-pairing with the three prime untranslated region (3’ UTR) of the target gene, causing cleavage/degradation of the cognate mRNA or by preventing translation initiation. Integration of miRNA expression with gene expression data to study the overall network of gene regulation is vital to understanding miRNA function in a given sample. Partek Genomics Suite provides a platform that can analyze miRNA and gene expression data independently, yet allows data to be integrated for downstream analysis.This integrative analysis can be accomplished at several different levels. If you only have miRNA data, then Partek Genomics Suite can search the predicted gene targets in a miRNA-mRNA database like TargetScan to provide a list of genes that might be regulated by the differentially expressed miRNAs. ConverselyAlternatively, if you have only gene expression data, Partek Genomics Suite can use the same database to identify the microRNAs that putatively regulate those differentially expressed genes in a statistically significant manner. If you have gene expression data and miRNA data from comparable tissue/species, Partek Genomics Suite can combine the results of these separate experiments into one spreadsheet. Lastly, if the miRNA and mRNA from the same source was analyzed (as in this tutorial), then you may statistically correlate the results of miRNA and gene expression assays.
...
This will create a new spreadsheet PutativeGenes that contains a miRNA and a putative gene target in each row. Because each miRNA can regulate multiple genes, the list will be much longer than the input miRNA list. Because each Each row contains a gene , so this spreadsheet can be analyzed using GO Enrichment and Pathway Enrichment tasks from the Biological Interpretation section of the workflow.
...
Using the gene list as input, a Fisher's Exact right-tailed p-value is calculated to show the overrepresentation of genes of interest for each miRNA in the database. THe The smaller the p-value, the more overrepresented the miRNAs are for the dataset. Target associations are taken from a database, TargetScan in this example. If the input list is a filtered list of gnees genes from an ANOVA calculation, the parent spreadsheet is used to identify the background list of genes from the array. Gene Genes in the array , but not in the significant gene list will be treated as background in the calculations.
...
- Select Find overrepresented miRNA target sets from the miRNA Integration section of the workflow
- Select TargetScan 7.1 from the Target Databse drop-down menu
- Select brain vs. heart genes from the mRNA Spreadsheet drop-down menu
- Select 4. Gene Symbol from the Column with gene symbols drop-down menu (Figure 5)
- Select OK
| Numbered figure captions | ||||
|---|---|---|---|---|
| ||||
|

...
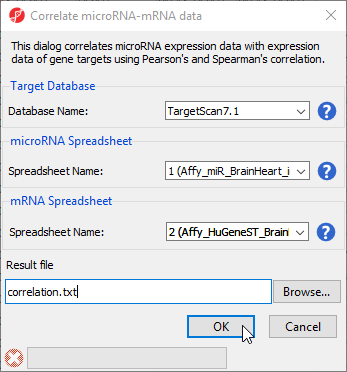
- Select Correlate miRNA and mRNA data from the miRNA Integration section of the workflow
- Select TargetScan7.1 from the Target Database drop-down menu
- Select Affy_miR_BrainHeart_intensities for the microRNA spreadsheet using the drop-down menu
- Select Affy_HuGeneST_BrainHeart_GeneIntensities as the mRNA spreadsheet using the drop-down menu (Figure 10)
- Select OK
| Numbered figure captions | ||||
|---|---|---|---|---|
| ||||
|
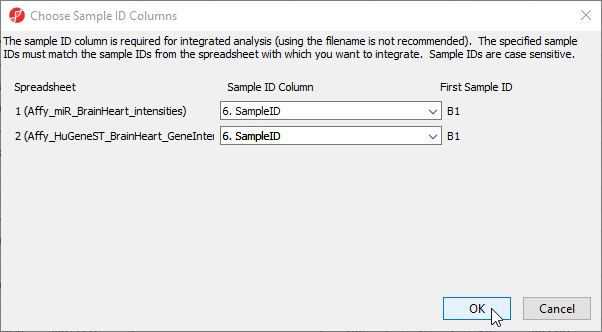
- Select 6. SampleID for Affy_miR_BrainHeart_intensities
- Select 6. SampleID for Affy_HuGeneST_BrainHeart_GeneIntensities
- Select OK (Figure 11)
| Numbered figure captions | ||||
|---|---|---|---|---|
| ||||
|
...
- Right-click a row header
- Select Scatter Plot (Orig. Data) from teh the pop-up menu
The correlation plot shows miRNA intensitiy on the x-axis and gene expression on the y-axis (Figure 13). Here, we see a negative correlation between expression of xtr-miR-148a_st and its target gene, RAB14, in brain and heart tissues. Drawing the scatter plot will create a temporary file with miRNA and gene expression probe intensities for all samples that is used to draw the plot.
...
Overview
Content Tools