Page History
...
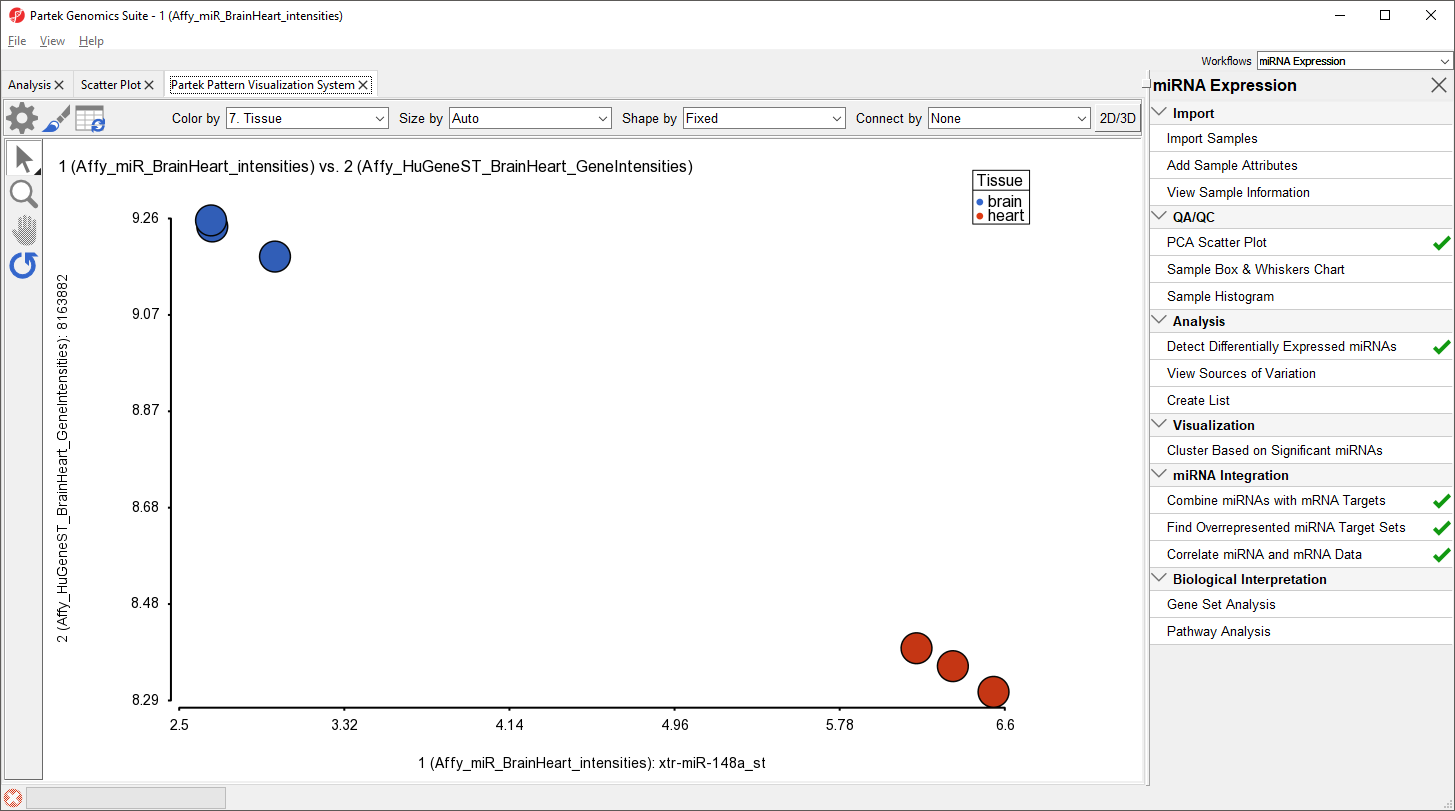
The correlation plot shows miRNA intensitiy on the x-axis and gene expression on the y-axis (Figure 13). Here, we see a negative correlation between expression of xtr-miR-148a_st and its target gene, RAB14, in brain and heart tissues. Drawing the scatter plot will create a temporary file with miRNA and gene expression probe intensities for all samples that is used to draw the plot.
| Numbered figure captions | ||||
|---|---|---|---|---|
| ||||
|
...
Overview
Content Tools