Page History
...
A new spreadsheet, brain vs. heart will be created as a child spreadsheet of Affy_miR_BrainHeart (Figure 9).
| Numbered figure captions | ||||
|---|---|---|---|---|
| ||||
|
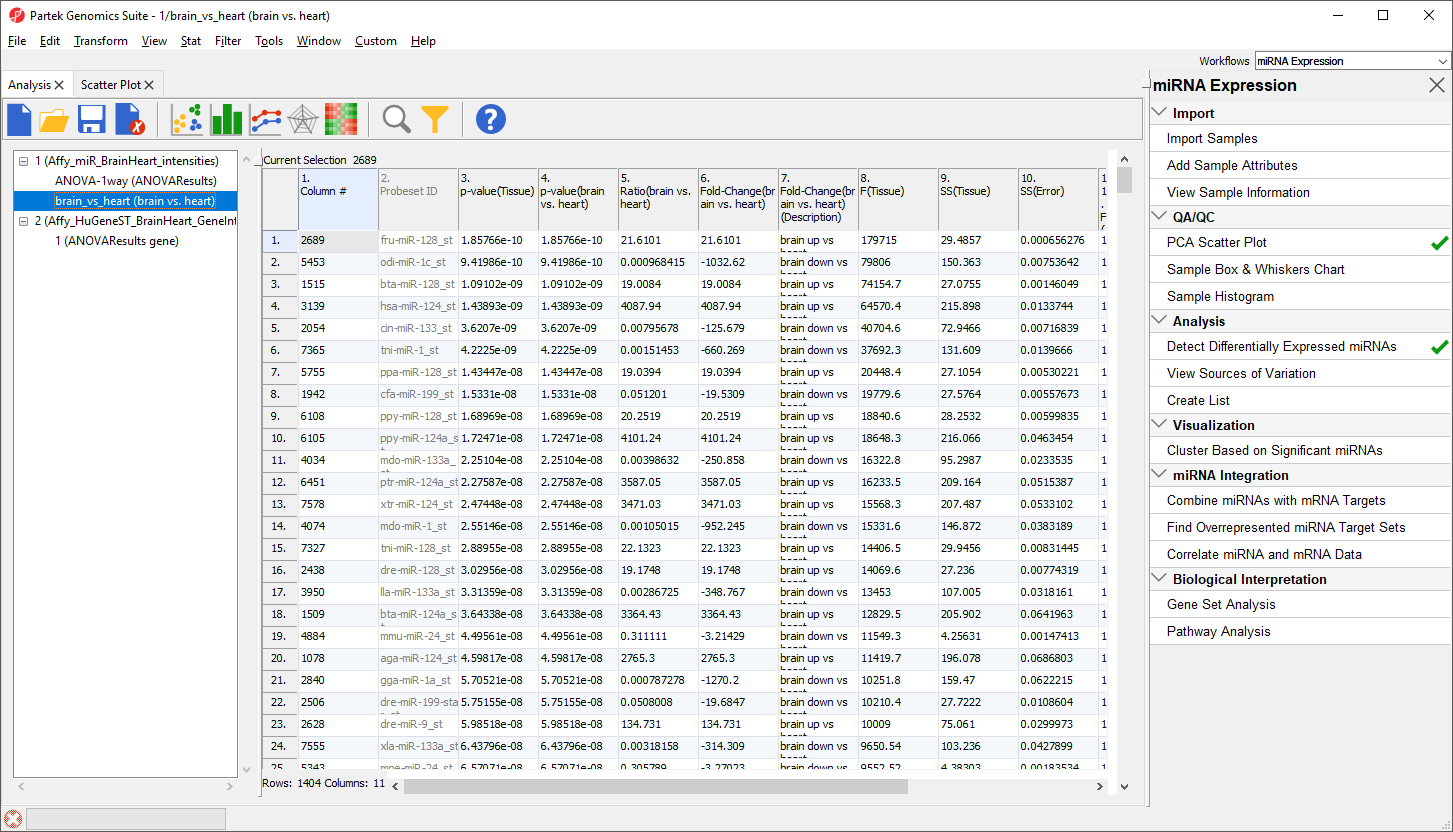
To view the miRNAs with the largest difference between tissues, we can sort by fold-change.
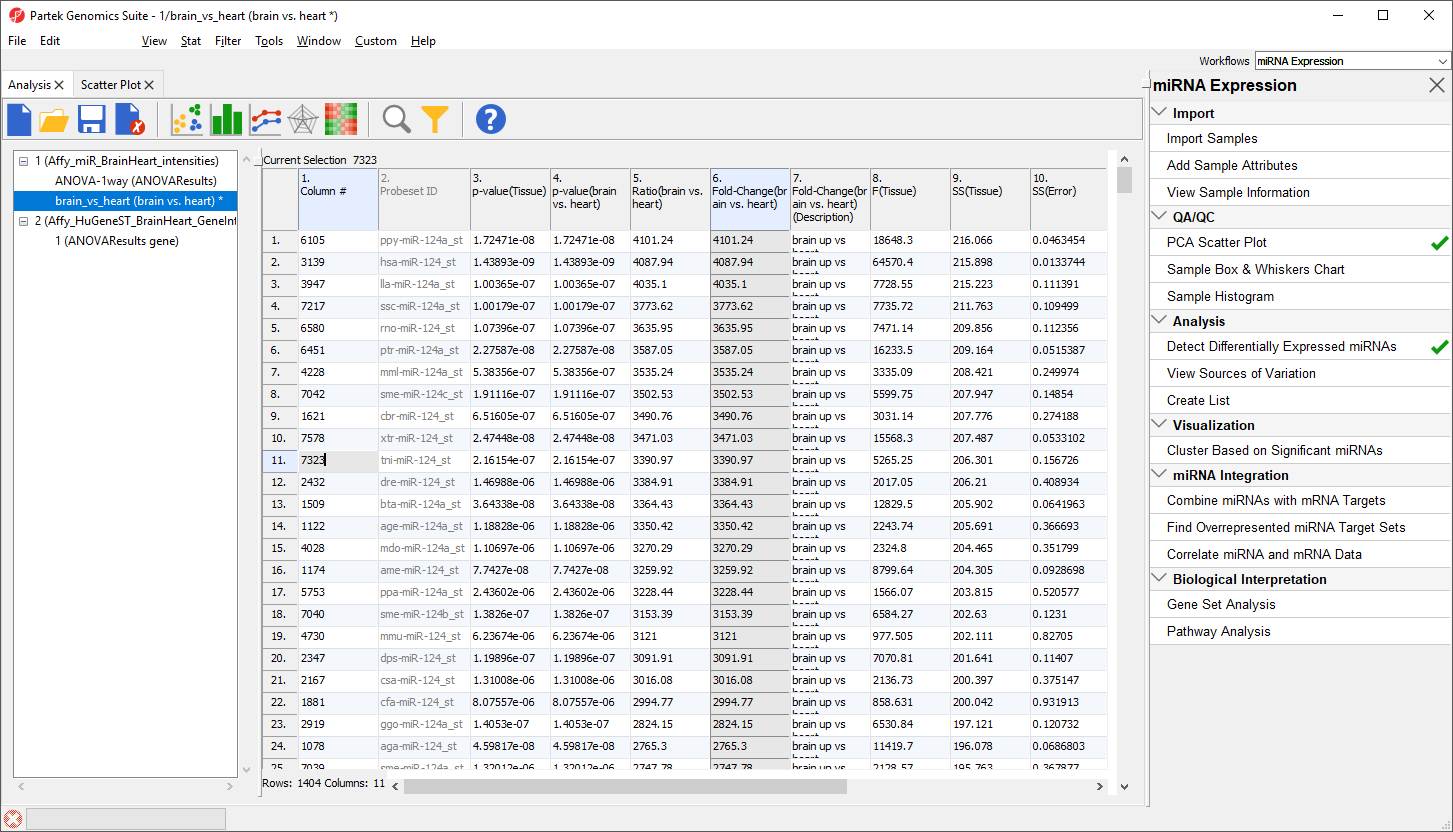
- Right-click the 6. Fold-Change(brain vs. heart) column header
- Select Sort Descending by Absolute Value from the pop-up menu
The top 33 miRNAs we see (Figure 10) are all miR-124 from different species. The miRNA miR-124 is the most abundant miRNA in neuronal cells so this finding is expected. The multiple species versions of miR-124 are present because all Affymetrix GeneChip miRNA arrays provide comprehensive coverage of miRNAs from multiple organisms including human, mouse, rat, canine, monkey, and many more on a single chip. The miRNAs from these different species are highly homologous so probes targeting miRNAs from other species will hybridize with human miRNAs. Therefore, we need to filter the list of miRNAs to include only human miRNAs.
| Numbered figure captions | ||||
|---|---|---|---|---|
| ||||
|
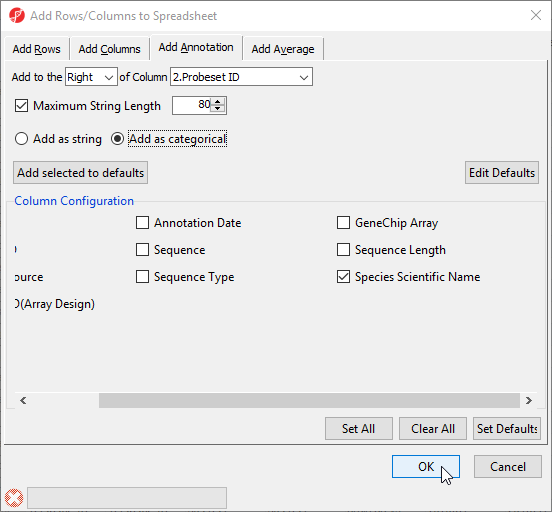
To do this, we need to add a new annotation column containing species information for each probe.
- Right-click on the 2. Probeset ID column header
- Select Insert Annotation from the pop-up menu
- Select Add as categorical
- Check Species Scientific Name (Figure 11)
- Select OK to add the annotation column
| Numbered figure captions | ||||
|---|---|---|---|---|
| ||||
|
The table now includes a column 3. Species Scientific Name with the species name of each miRNA. We can now filter to include only human miRNAs.
- Right-click the 3. Species Scientific Name column header
- Select Find / Replace / Select... from the pop-up menu
- Type Homo sapiens for Find What
- Select Only in column for Search
- Select 3. Species Scientific Name from the drop-down menu next to the Only in column option
- Select Select All (Figure 12)
| Numbered figure captions | ||||
|---|---|---|---|---|
| ||||
|
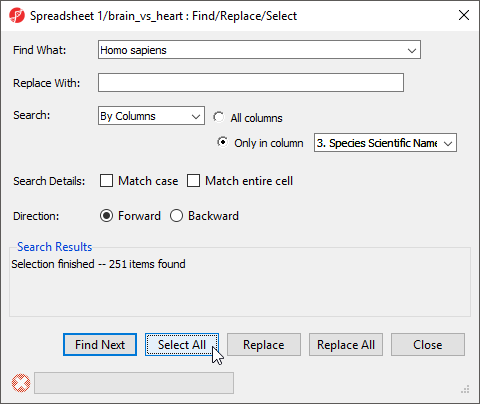
The search should find and select 251 miRNAs.
- Select Close
- Right-click any of the row headers that are selected
- Select Filter Include from the pop-up menu
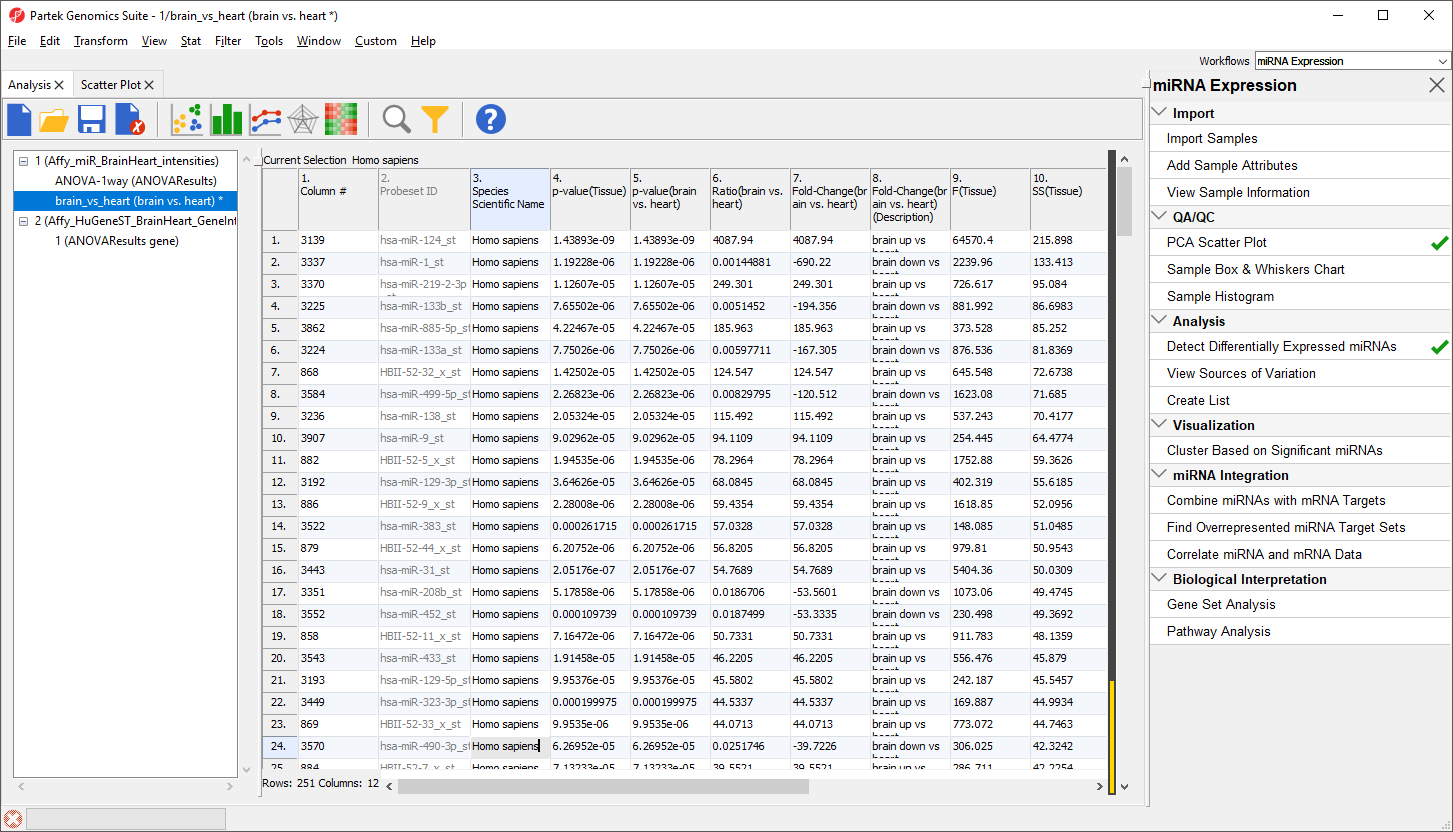
The spreadsheet will now include only the 251 miRNAs from human (Figure 13). The first row is still miR-124 with a fold change of 4087.94. The black and gold bar on the right-hand side of the spreadsheet indicates the fraction of rows that have been filtered. To retain this filtered list, we can create a new spreadsheet.
| Numbered figure captions | ||||
|---|---|---|---|---|
| ||||
|
- Right-click the brain_vs_heart spreadsheet in the spreadsheet tree
- Select Clone... from the pop-up menu
Cloning a spreadsheet while a filter is applied copies only the included rows/columns.
- Name the spreadsheet brain_vs_heart_human
- Select Affy_miR_BrainHeart_intensities from the drop-down menu Create new spreadsheet as a child of spreadsheet
- Select

- Name the new file brain vs. heart human
- Select Save
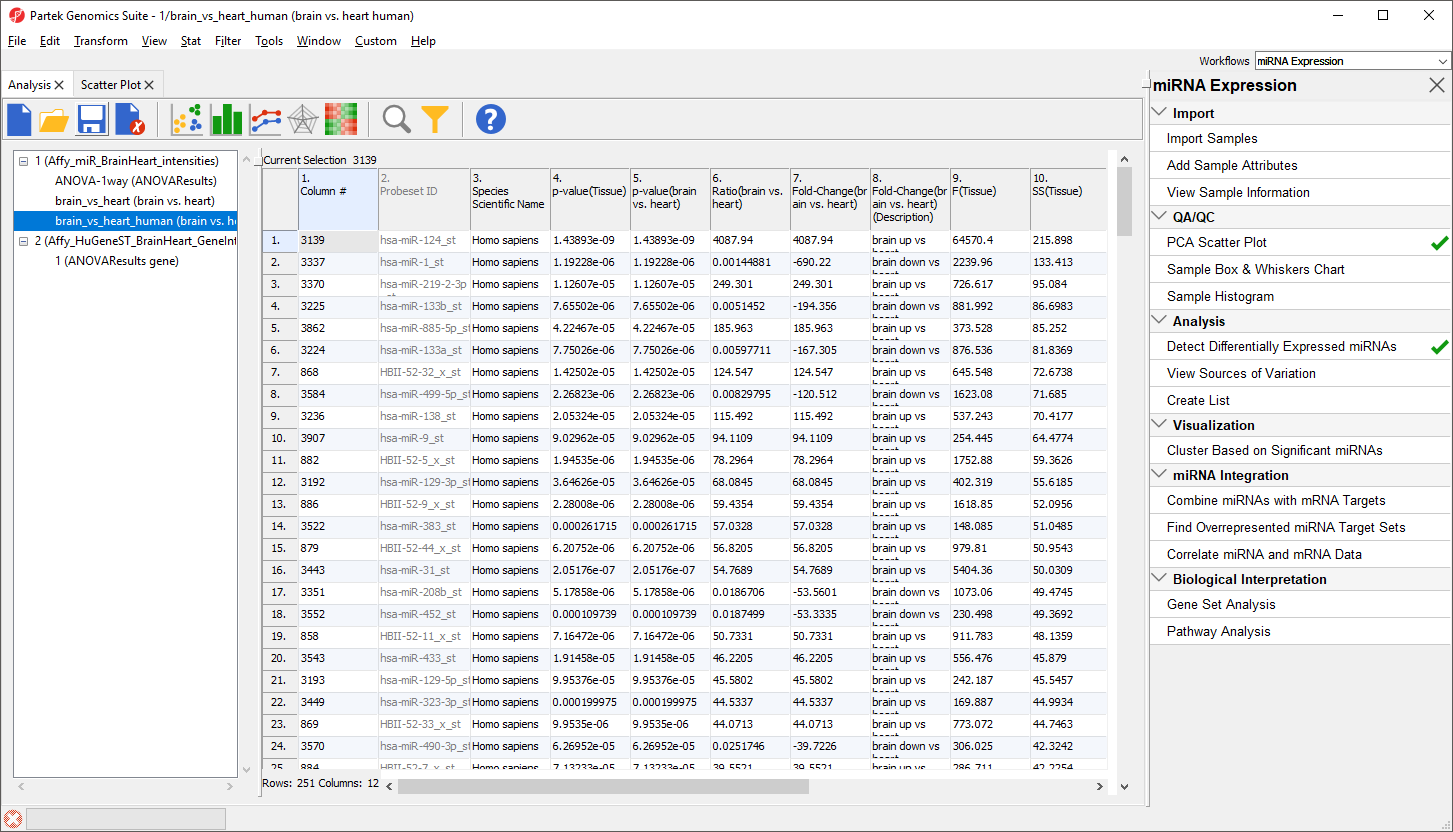
The new spreadsheet includes only the 251 human miRNAs that are significantly differentially expressed between brain and heart tissue (Figure 14).
| Numbered figure captions | ||||
|---|---|---|---|---|
| ||||
|
The next step in our analysis will be integrating miRNA and gene expression data.
| Page Turner | ||
|---|---|---|
|
| Additional assistance |
|---|
|
| Rate Macro | ||
|---|---|---|
|
Overview
Content Tools