Join us for a webinar: The complexities of spatial multiomics unraveled
May 2
Page History
...
- Select Create Marker List from the Analysis section of the Illumina BeadArray Methylation workflow
- Select the Advanced tab (Figure 1)
| Numbered figure captions | ||||
|---|---|---|---|---|
| ||||
|
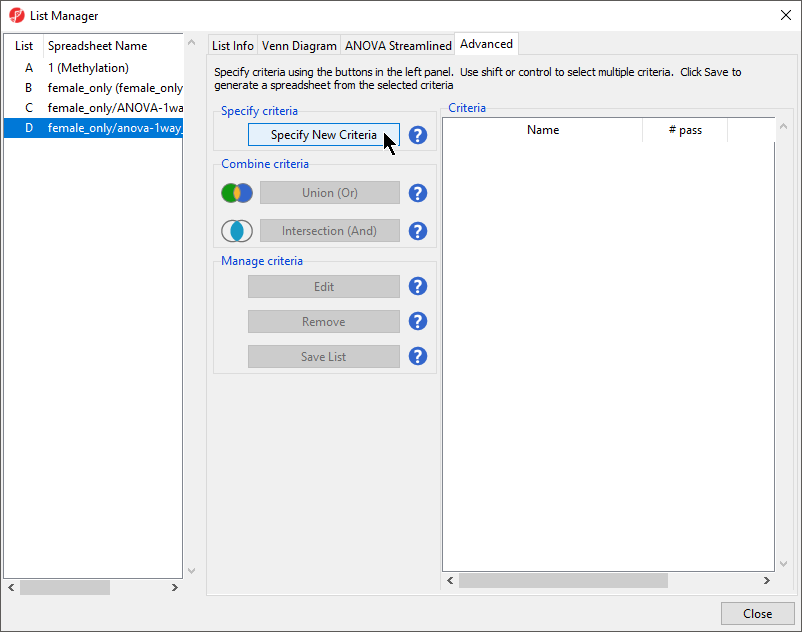
- Select Specify New Criteria to launch the Configure Criteria dialog
- Select female_only/anova-1way_autosomal (autosomal) as the source spreadsheet from the left-hand panelSelect from the Spreadsheet drop-down menu
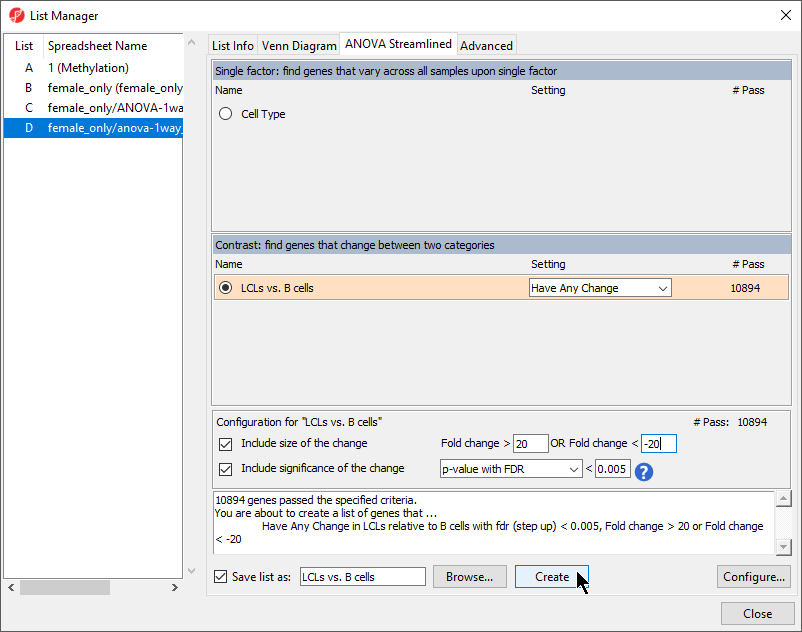
- Select 12. Estimate(LCLs vs. B cells from the Contrast: find genes that change between two categories section of the ANOVA Streamlined tab of the List Manager dialog
- Set Fold change > to 20
- Set OR Fold change < to -20
- Set p-value with FDR to 0.005
- Set file name as LCLs vs. B cells
- Leave the rest of the option set to defaults (Figure 1)
...
- cells) from the Column drop-down menu
- Set Include values to less than or equal to with -5 and greater than or equal to with 5 (Figure 2)
| Numbered figure captions | ||||
|---|---|---|---|---|
| ||||
|
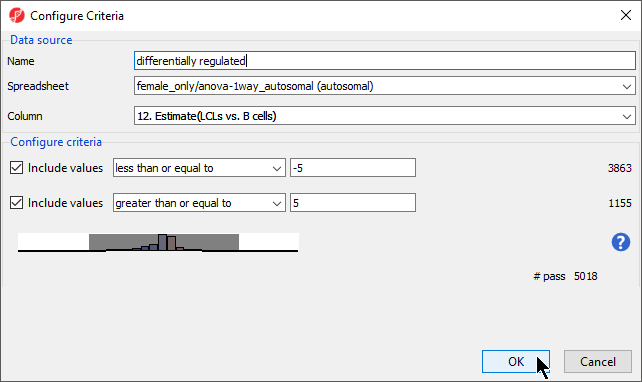
- Name this list; we have chosen differentially regulated
- Select OK
The criteria differentially regulated has been added to the Criteria list (Figure 3).
| Numbered figure captions | ||||
|---|---|---|---|---|
| ||||
|
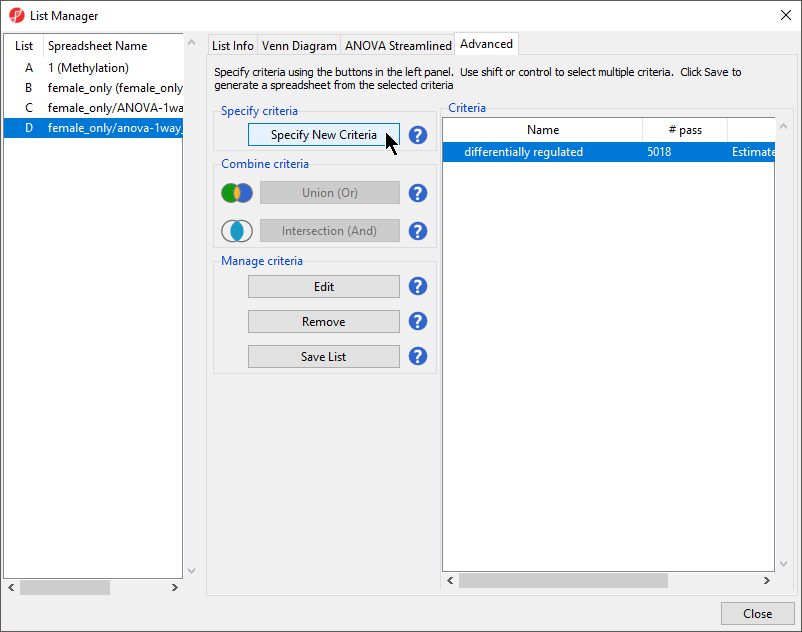
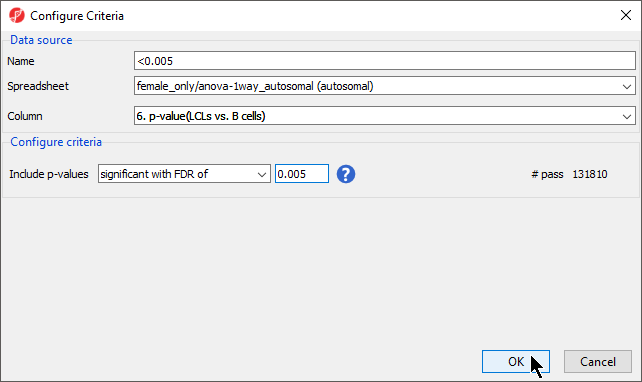
- Select Specify New Criteria
- Select female_only/anova-1way_autosomal (autosomal) from the Spreadsheet drop-down menu
- Select 6. p-value(LCLs vs. B cells) from the Column drop-down menu
- Set Include p-values to significant with FDR of at 0.005 (Figure 4)
| Numbered figure captions | ||||
|---|---|---|---|---|
| ||||
|
...
| |||
|
- Name this list; we have chosen <0.005
- Select OK
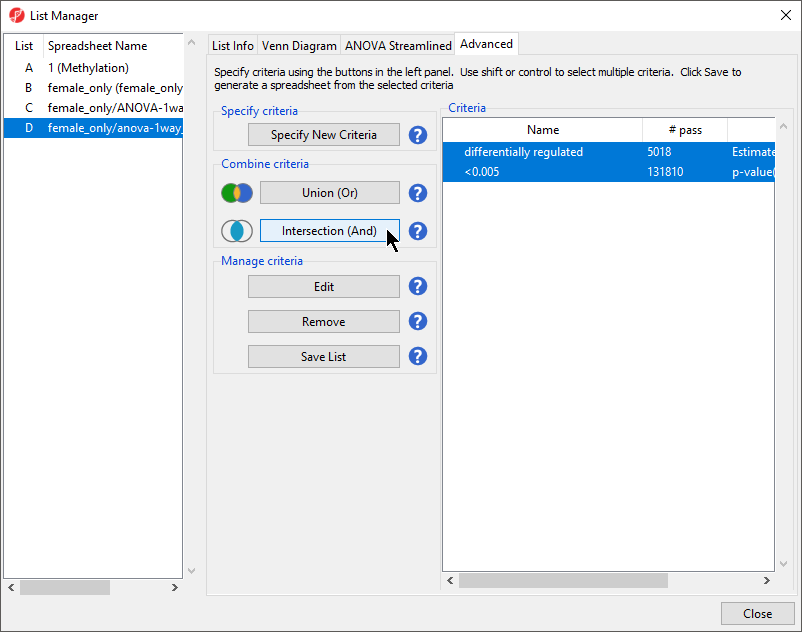
Both differentially regulated and <0.005 are listed in the Criteria panel. We can use the Combine criteria tools to generate a single combined filter.
- Select Intersection (And) from Combine criteria to create a combined filter
- Name the new filter; we have chosen LCLs vs. B cells
- Select Save List (Figure 5)
| Numbered figure captions | ||||
|---|---|---|---|---|
| ||||
|
- Select OK from the List Creator dialog to generate a list using the LCLs vs. B cells filter
- Select Close to exit the List Manager dialog
The new spreadsheet spreadsheet LCLs vs. B cells (LCLs vs. B cells) will open in the Analysis tab (Figure 2).
| Numbered figure captions | ||||
|---|---|---|---|---|
| ||||
|
...
Overview
Content Tools